OpenClaw TradingView Quantitative Analysis Skill: Complete Usage Guide
Executive Summary
OpenClaw TradingView Quant Skill (openclaw-tradingview-quant) is an AI-powered quantitative investment analysis system released in March 2026. It transforms AI assistants into professional market analysts through 15 pre-built analysis workflows, a 100-point technical scoring model, and institutional-grade risk management frameworks.
Key Statistics:
- Installation time: <30 seconds (single command:
npx skills add ljsd666/openclaw-tradingview-quant) - Analysis workflows: 15 professional frameworks covering screening, analysis, risk management
- Market coverage: 8+ global markets, 160,000+ instruments, 353+ crypto exchanges
- Scoring model: 100-point system across 5 dimensions (trend 30pts, momentum 25pts, patterns 20pts, support/resistance 15pts, sentiment 10pts)
- Pattern recognition: 12+ classic chart patterns with confidence scoring
- Configuration required: Zero (no API keys, no setup, works immediately)
Target users: Traders, investors, quantitative analysts, fintech developers seeking systematic market analysis without programming.
Want to analyze stocks like a professional quant — using AI to screen opportunities, interpret technical indicators, and manage risk — without writing a single line of analysis code?
The OpenClaw TradingView Quant Skill is a professional quantitative investment analysis system that transforms your AI assistant into a market analysis expert. Built on TradingView API data structures, it provides 15 pre-built analysis workflows, a 100-point technical scoring model, and professional risk management frameworks covering stocks, cryptocurrencies, forex, and futures across 8+ global markets.
Market Data Coverage (March 2026):
- Trading instruments: 160,000+ across all asset classes
- Stock exchanges: NYSE, NASDAQ, HKEX, SSE, SZSE, TSE, LSE, Euronext, and 60+ more
- Crypto exchanges: 353+ including Binance, Coinbase, Kraken, OKX, Bybit
- Data provider: TradingView API serving 10,000+ developers via RapidAPI
According to RapidAPI marketplace data, the TradingView Data API serves over 10,000 developers and covers 160,000+ financial instruments, making this skill one of the most comprehensive AI-powered analysis tools available for individual investors and quantitative analysts.
This guide is for: Traders, investors, and developers who want to leverage AI for systematic market analysis. No programming experience required — just natural language queries.
What you’ll learn:
- How to install and configure the skill in under 30 seconds
- Using smart stock screening with multi-factor scoring
- Performing deep individual stock analysis across multiple timeframes
- Conducting daily market reviews with sector rotation tracking
- Implementing professional risk management with position sizing
Key Takeaway: By the end of this guide, you’ll be able to use 15 professional analysis workflows to screen stocks, analyze technical patterns, review markets, and manage risk — all through natural language conversations with your AI assistant. The skill covers US stocks, global markets, crypto, forex, and futures.
What is the OpenClaw TradingView Quant Skill?
Last Updated: March 13, 2026
The OpenClaw TradingView Quant Skill (openclaw-tradingview-quant) is an AI skill that provides professional quantitative investment analysis frameworks and methodologies based on TradingView API data structures. It turns your AI assistant into a market analysis expert capable of systematic stock screening, multi-timeframe technical analysis, pattern recognition, and risk-adjusted position sizing.
Release Information:
- Launch date: March 2026
- Current version: 1.0
- Package name:
ljsd666/openclaw-tradingview-quant - Installation method: npm/npx
- License: Open source
Core capabilities at a glance:
| Feature | Description | Workflow |
|---|---|---|
| Smart Stock Screening | Multi-factor scoring with technical + fundamental filters | smart-screening.md |
| Deep Stock Analysis | Comprehensive individual stock evaluation | deep-stock-analysis.md |
| Technical Pattern Recognition | Classic pattern identification with confidence scoring | pattern-recognition.md |
| Market Review | Daily hot sector tracking and capital flow analysis | market-review.md |
| Risk Management | Kelly Formula position sizing and stop-loss strategies | risk-assessment.md |
| Sector Rotation | Cross-sector performance comparison and trend analysis | sector-rotation.md |
| Event-Driven Analysis | Earnings, policy, and news impact frameworks | event-analysis.md |
| Multi-Timeframe Analysis | D/W/M trend confirmation across timeframes | multi-timeframe-analysis.md |
Key advantages:
- Zero configuration: Install and start using immediately — no API keys or setup required (installation time: <30 seconds)
- Natural language interface: Ask questions in plain English or Chinese — no programming skills needed
- Professional methodologies: Analysis frameworks used by institutional quantitative analysts (100-point scoring model, Kelly Formula position sizing, multi-timeframe validation)
- Multi-market coverage: 8+ markets including US (NYSE, NASDAQ), China (SSE, SZSE), Hong Kong (HKEX), Japan (TSE), Europe (LSE, Euronext), 353+ crypto exchanges, forex pairs, futures
- Comprehensive workflows: 15 analysis frameworks covering full investment lifecycle from screening to risk management
- Pattern recognition: 12+ classic chart patterns with confidence scoring (0-100%) and historical success rates
How to Install the OpenClaw Quant Skill
Step 1: Run the Install Command
Open your terminal and run:
npx skills add ljsd666/openclaw-tradingview-quantThe installation typically completes in under 30 seconds. No additional dependencies, API keys, or configuration files are needed.
Step 2: Verify the Installation
After installation, your project directory will contain:
openclaw-tradingview-quant/
├── SKILL.md                     # AI skill description
├── SECURITY.md                  # Security policy
├── references/                  # 8 reference files + 9 API examples
│   ├── api-examples/            # Real API response format examples
│   ├── api-documentation.md     # Complete TradingView API docs
│   ├── technical-analysis.md    # 100-point scoring methodology
│   ├── pattern-library.md       # Pattern recognition algorithms
│   ├── risk-management.md       # Position and risk management
│   └── us-stock-examples.md # Practical case studies
└── workflows/                   # 15 analysis workflow files
    ├── smart-screening.md
    ├── deep-stock-analysis.md
    ├── market-review.md
    └── ... (12 more workflows)
Step 3: Start Analyzing
Simply ask your AI assistant a market analysis question. The skill is automatically activated when you ask about stock analysis, technical indicators, market screening, risk management, or trading strategies.
Pro Tip: The skill works with any AI assistant that supports the OpenClaw skills format, including Claude, ChatGPT, and other compatible platforms.
Smart Stock Screening: Find Quality Opportunities
The smart screening workflow uses a multi-factor model to filter quality targets from the market, combining technical and fundamental analysis into a comprehensive scoring system.
How the Screening Process Works
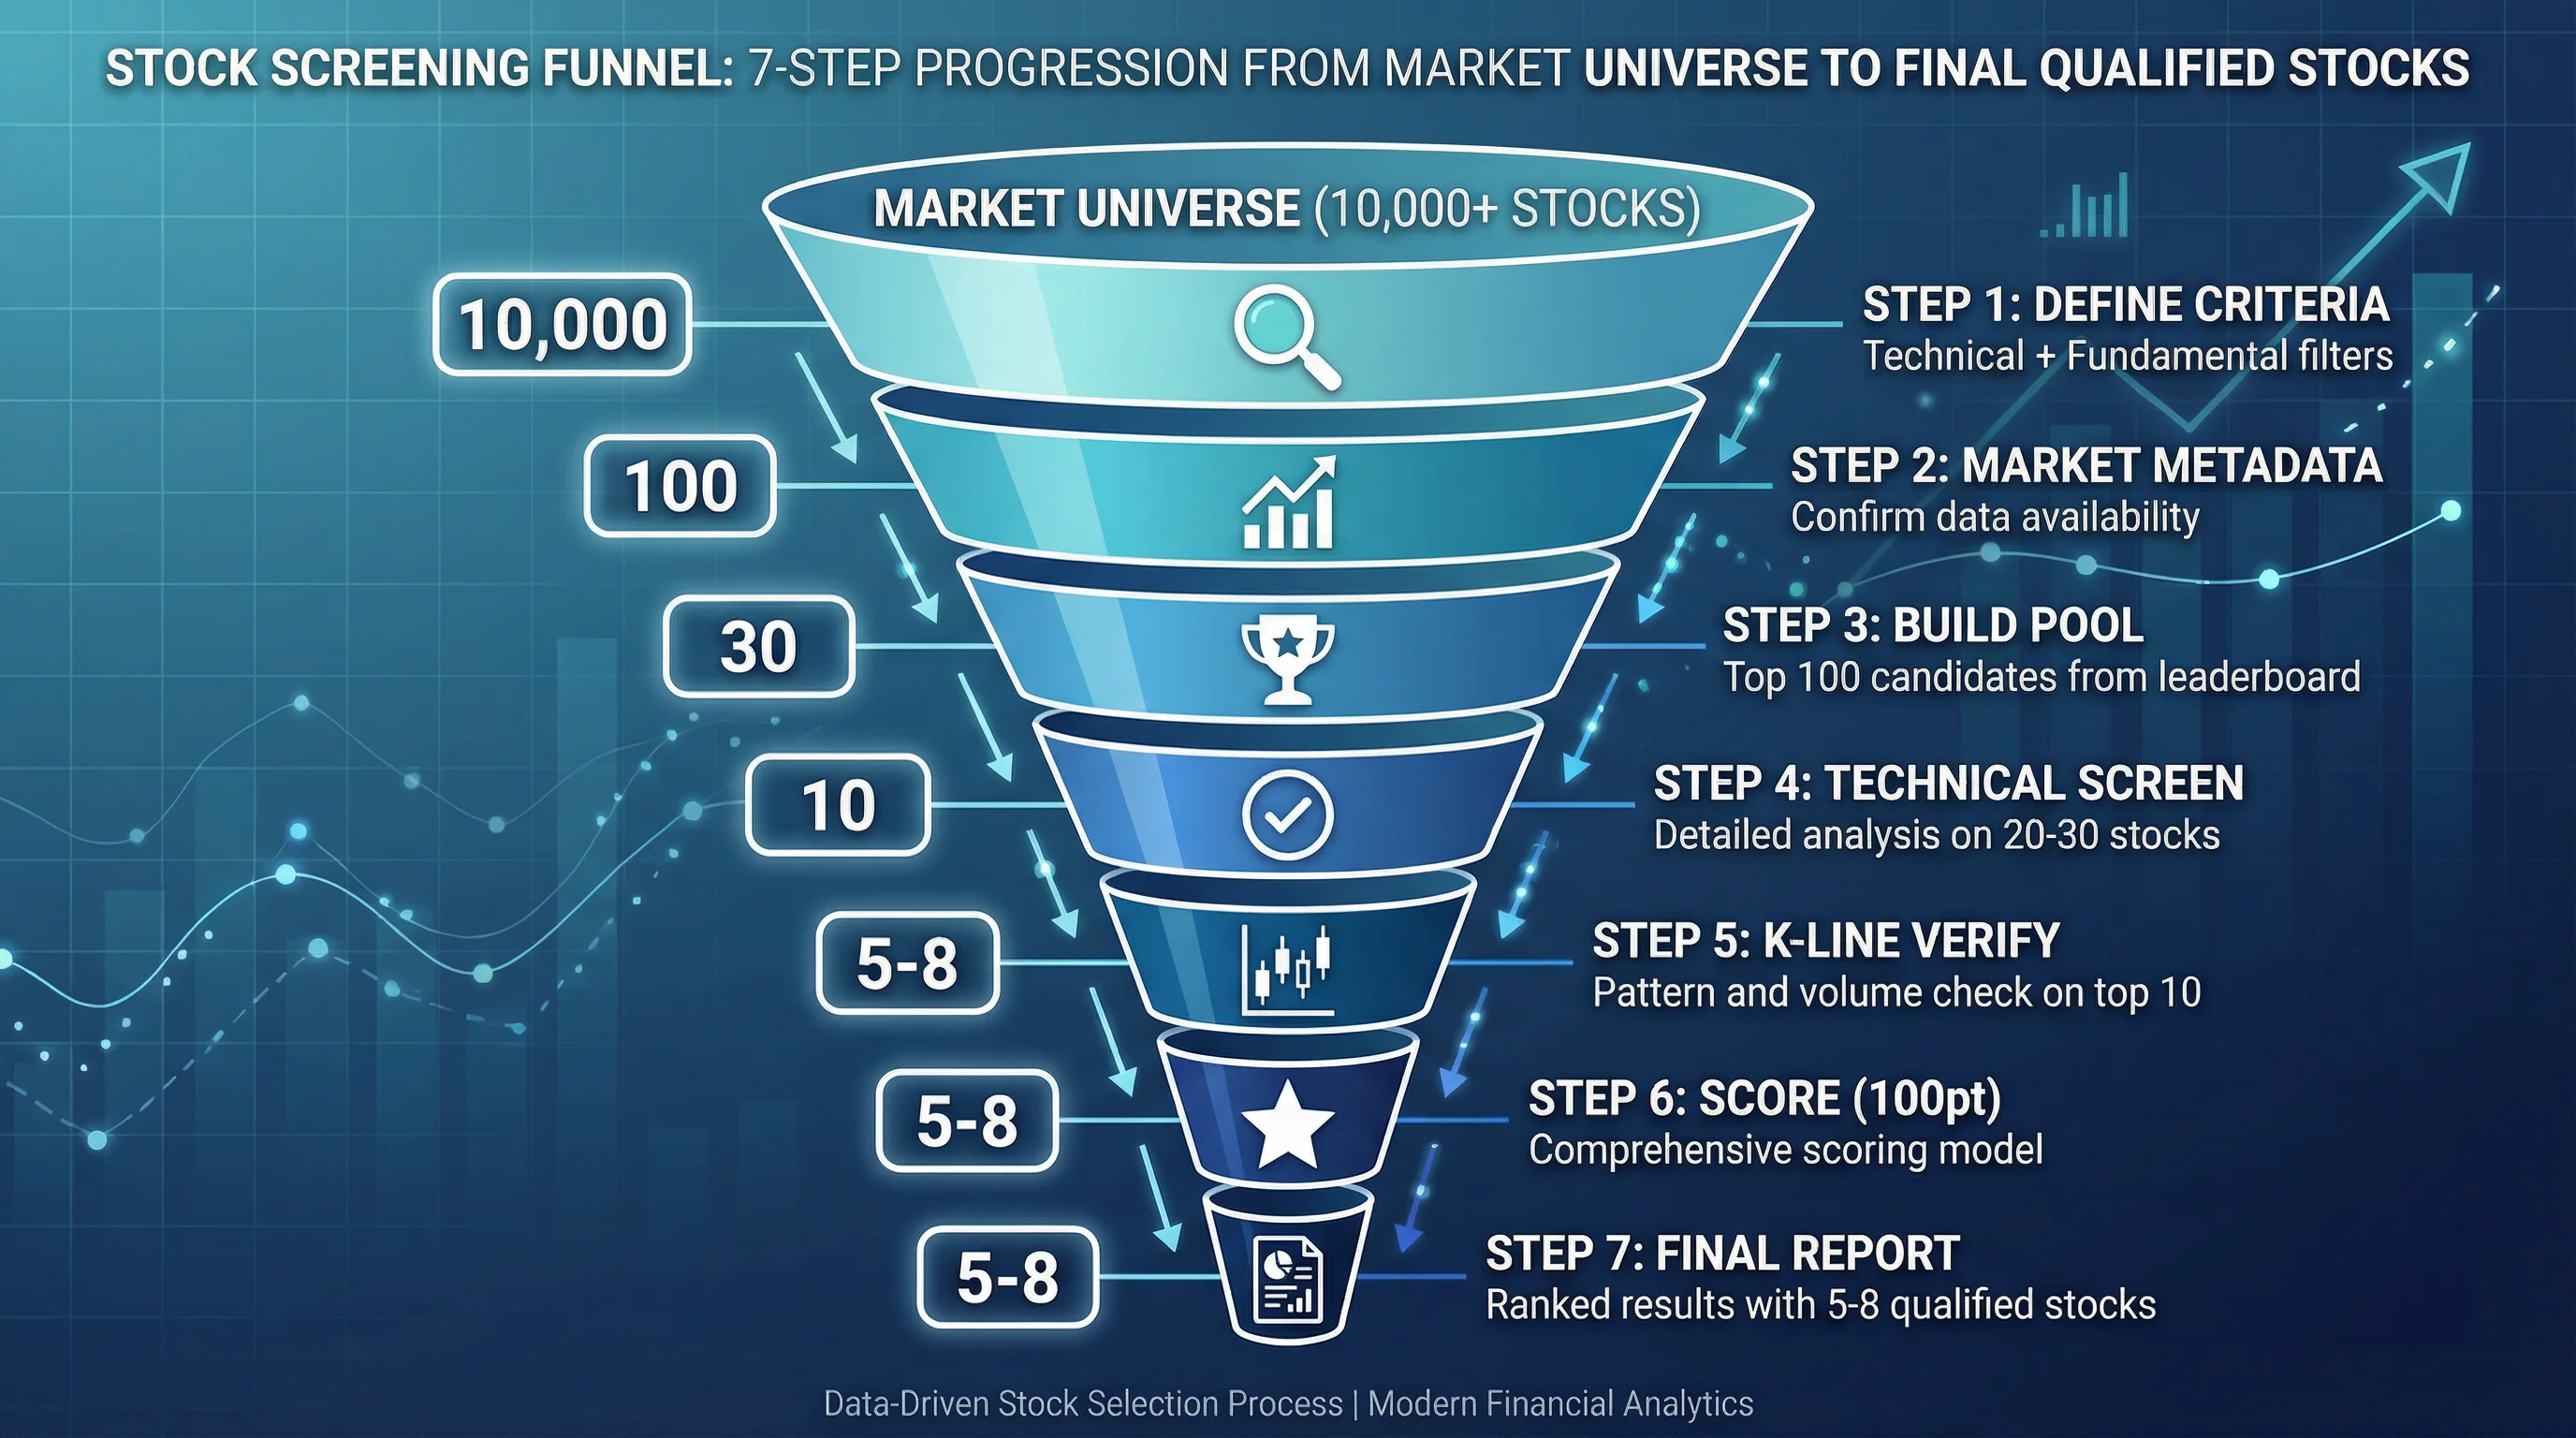
The screening follows a 7-step funnel that progressively narrows candidates:
- Define screening criteria — Market scope, technical conditions, fundamental filters
- Get market metadata — Confirm market codes and available data tabs
- Build candidate pool — Pull top 100 candidates from leaderboard rankings
- Technical screening — Run detailed technical analysis on top 20-30 candidates
- K-line verification — Verify price patterns and volume for top 10
- Comprehensive scoring — Apply 100-point scoring model
- Generate report — Output ranked results with trading recommendations
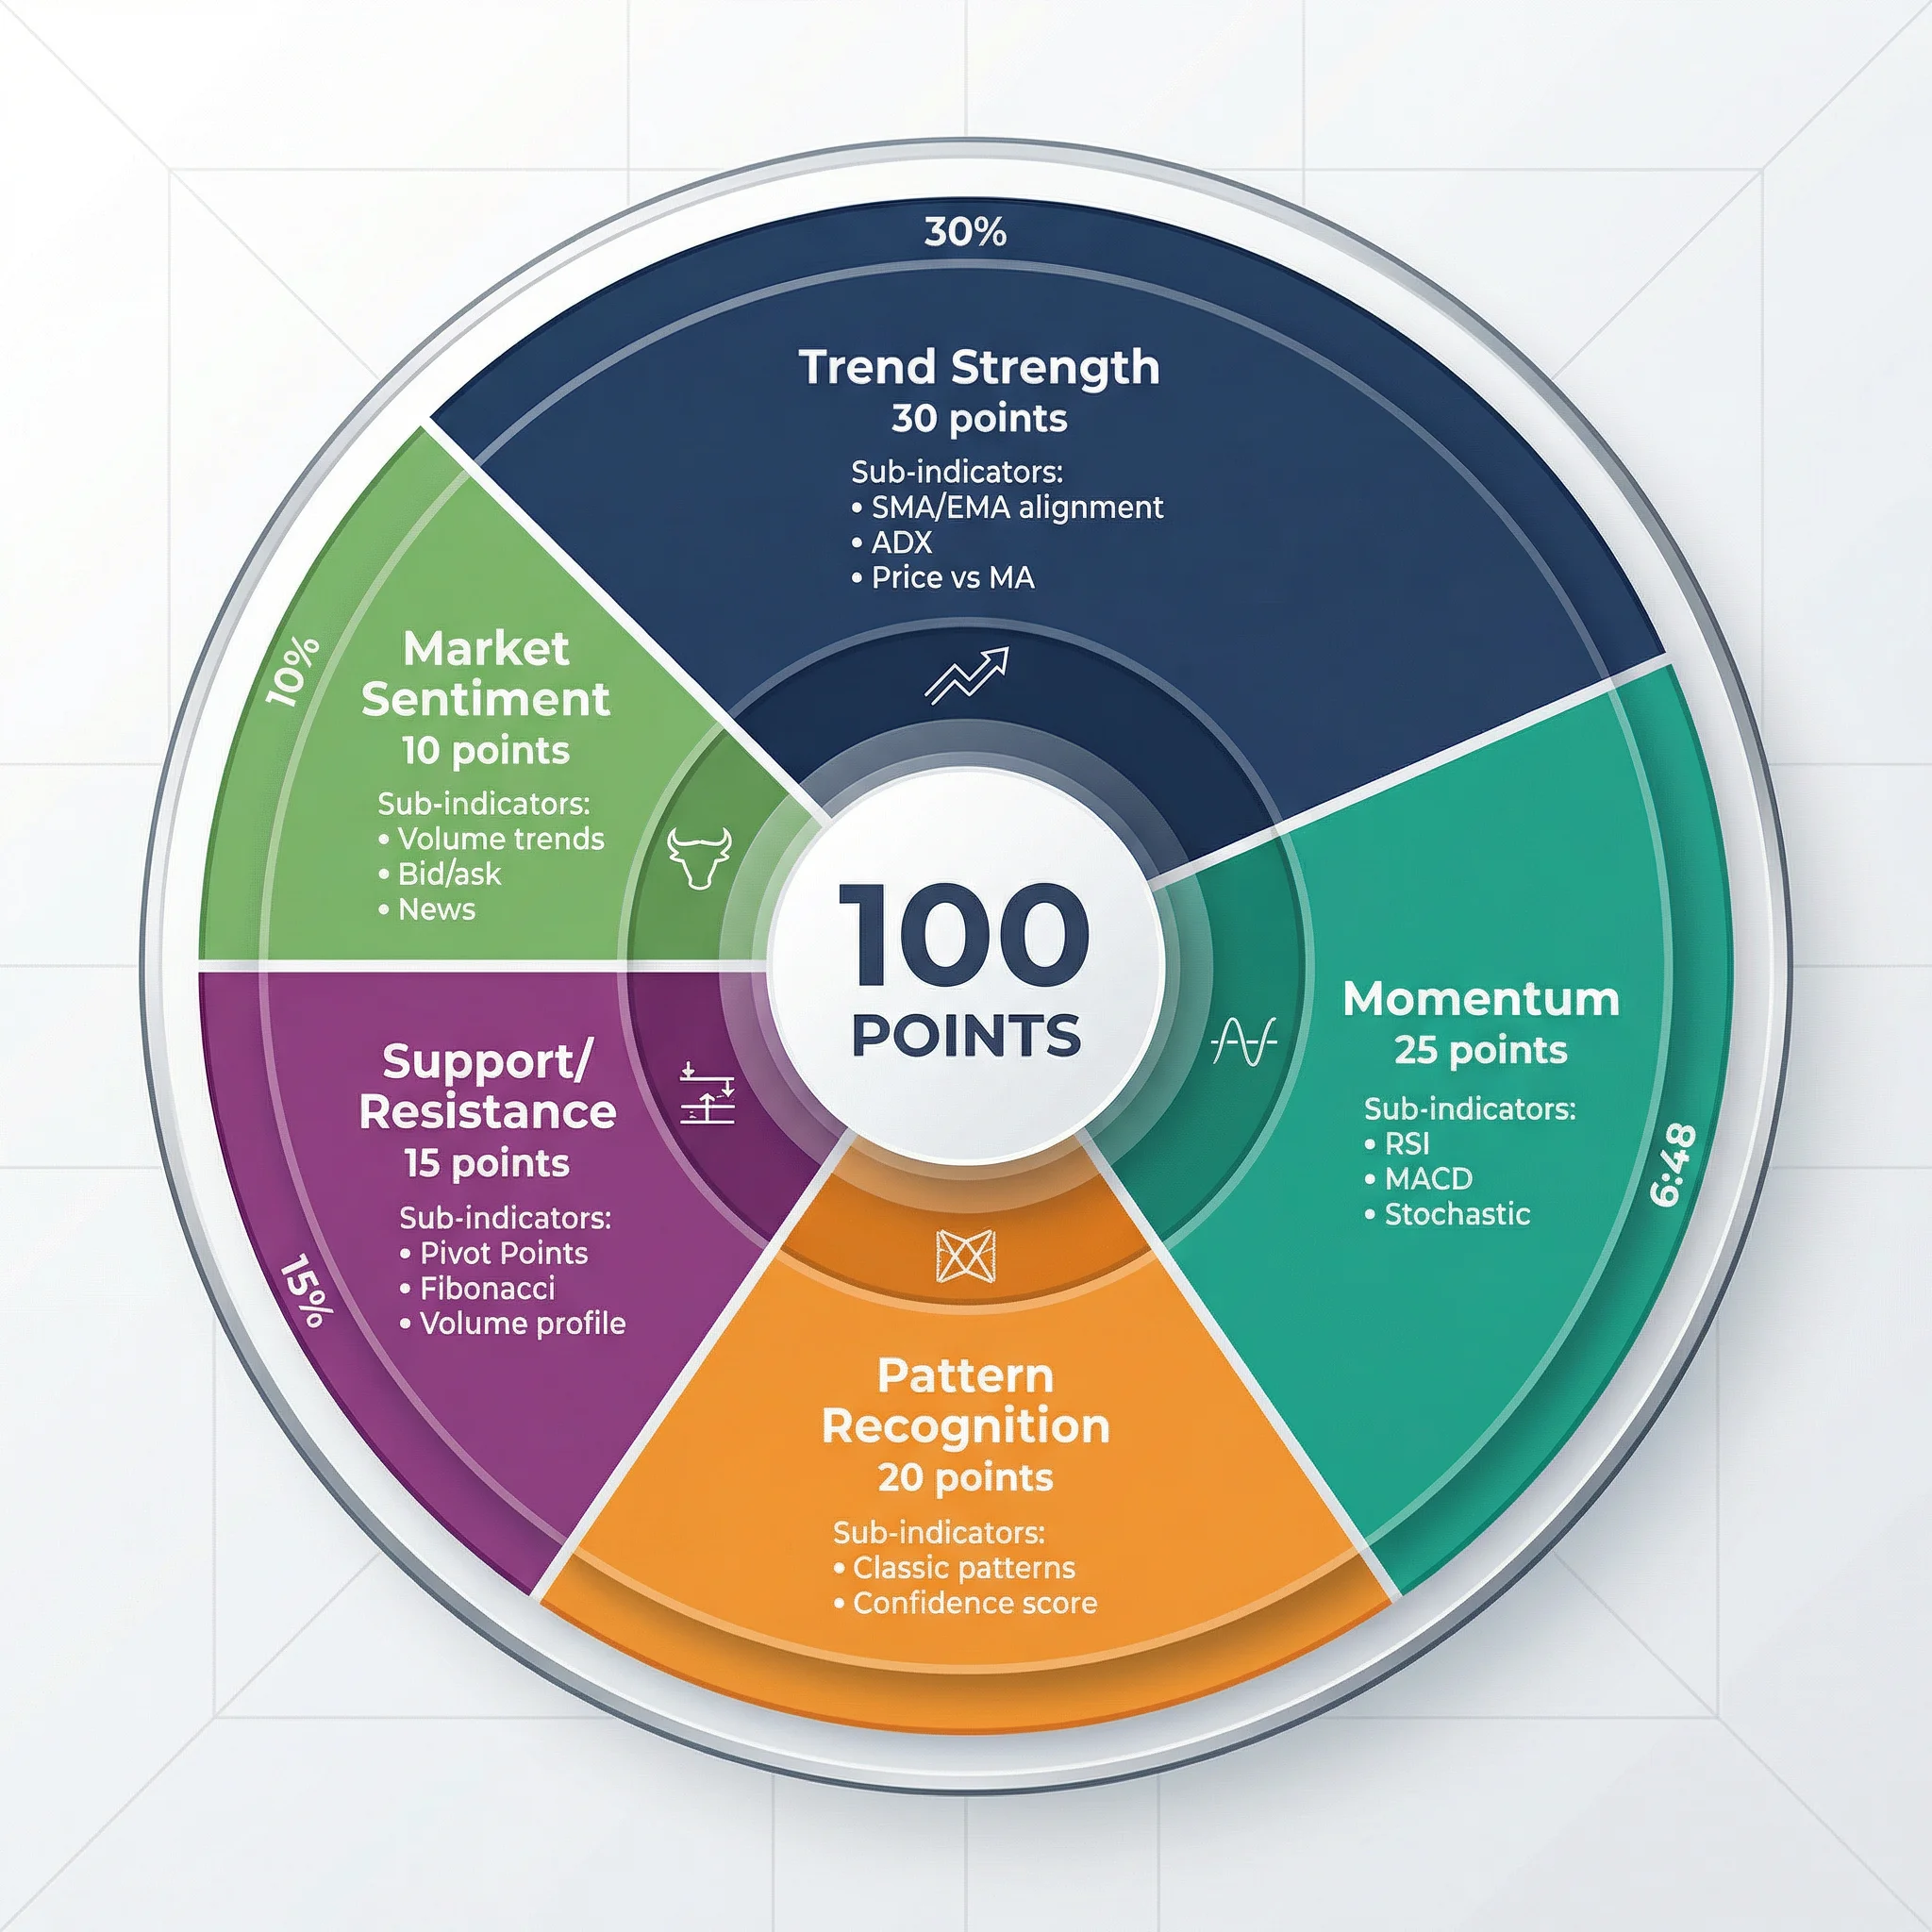
The 100-Point Technical Scoring Model
Every screened stock receives a comprehensive score across 5 dimensions:
| Dimension | Weight | Key Indicators |
|---|---|---|
| Trend Strength | 30 points | SMA/EMA alignment, ADX value, price vs. moving averages |
| Momentum | 25 points | RSI range, MACD signal, Stochastic crossovers |
| Pattern Recognition | 20 points | Classic patterns (head & shoulders, double bottom, flags) |
| Support/Resistance | 15 points | Pivot Points, Fibonacci levels, volume profile |
| Market Sentiment | 10 points | Volume trends, bid/ask analysis, news sentiment |
Example: Screening US Tech Stocks
Help me select strong stocks from US technology sector, focusing on:
- Technology sector (software, semiconductors, cloud)
- RSI between 40-70 (not overbought)
- MACD golden cross within last 5 days
- Market cap above $10 billion
The AI executes the full screening workflow:
- Pulls top 100 gainers from US market leaderboard (NYSE, NASDAQ)
- Fetches valuation and profitability data for fundamental filtering
- Runs technical analysis with
include_indicators=trueon top candidates - Verifies with 60-day daily K-line data for moving average alignment
- Outputs a ranked report with scores, entry prices, and stop-loss levels
Sample output structure:
# Smart Stock Screening Results — US Technology Sector

## Qualified Stocks (8 of 100 candidates passed)

### 1. Advanced Micro Devices (NASDAQ:AMD) ⭐⭐⭐⭐⭐
Comprehensive Score: 87/100
- Technical: RSI=55, MACD=Golden Cross, Trend=Strong Bullish
- Fundamental: PE=25.3, ROE=18.7%
- Buy Recommendation: $145.20-146.80
- Stop Loss: $142.50
- Target Price: $152.00
Deep Individual Stock Analysis
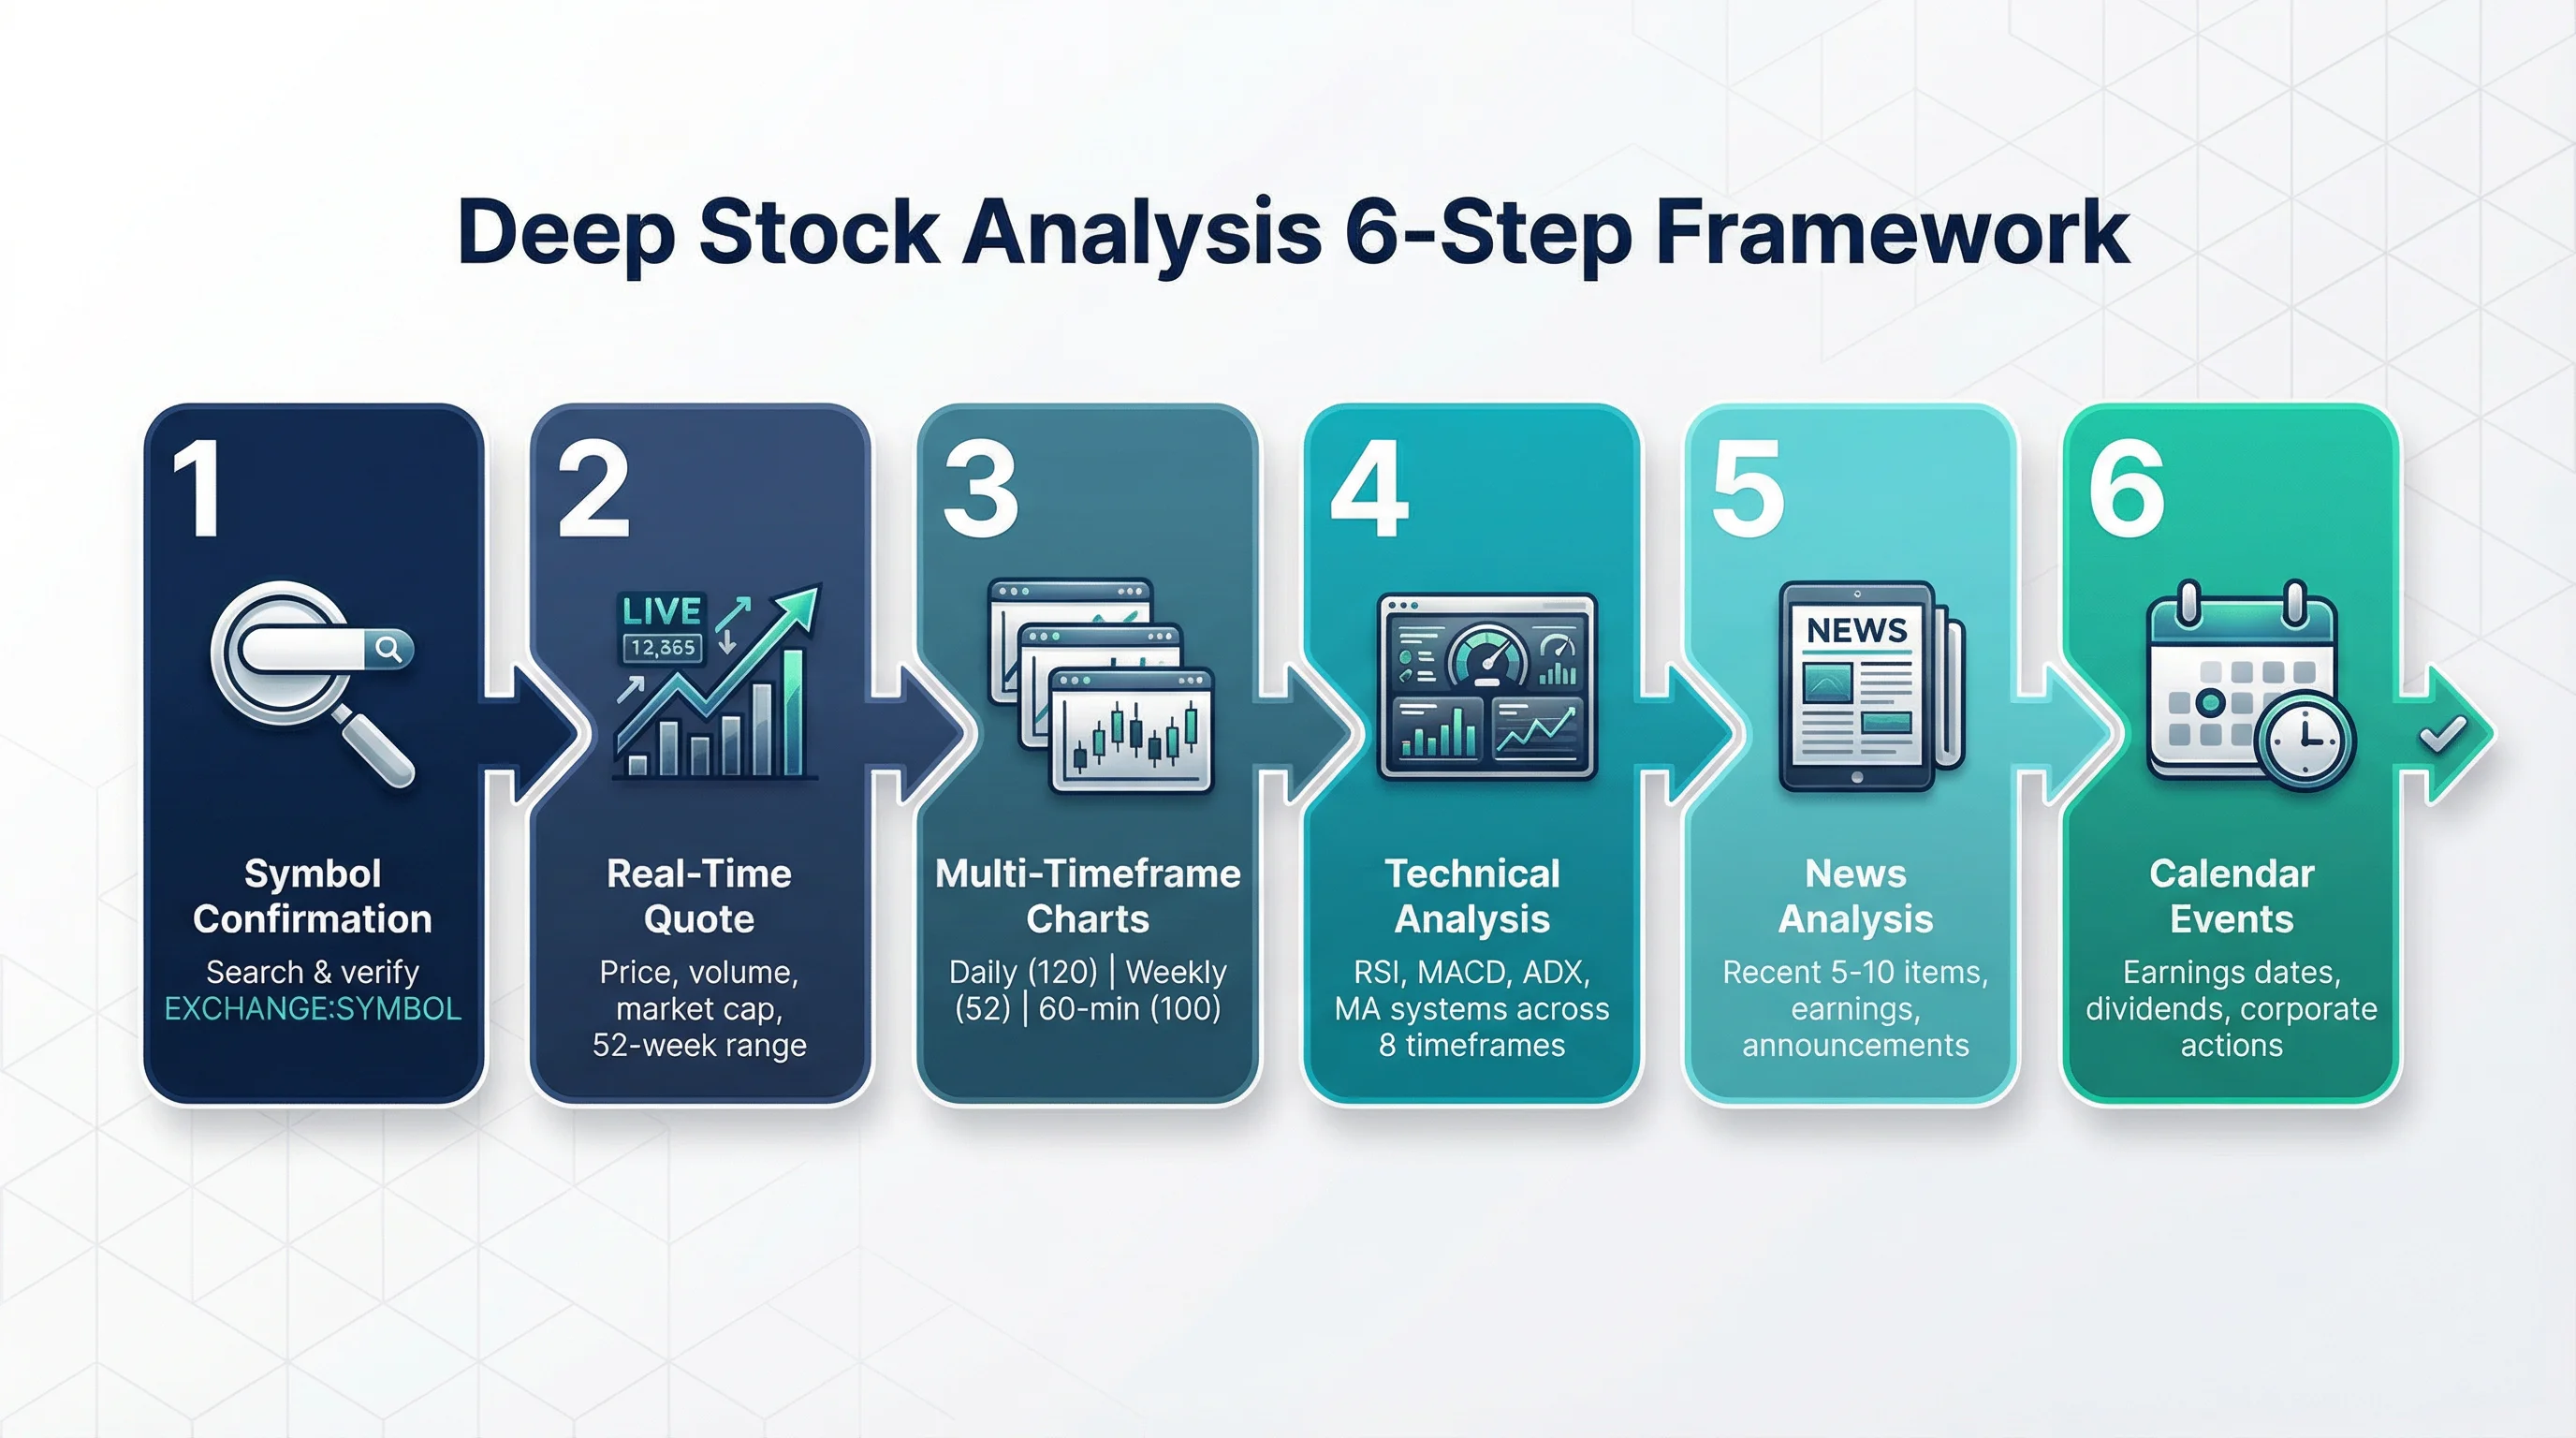
When you want a comprehensive evaluation of a specific stock, the deep analysis workflow combines 6 data sources into an integrated report.
The 6-Step Analysis Framework
Step 1: Symbol Confirmation — Search by name or ticker to confirm the exact EXCHANGE:SYMBOL format (e.g., NASDAQ:AAPL, NYSE:TSLA).
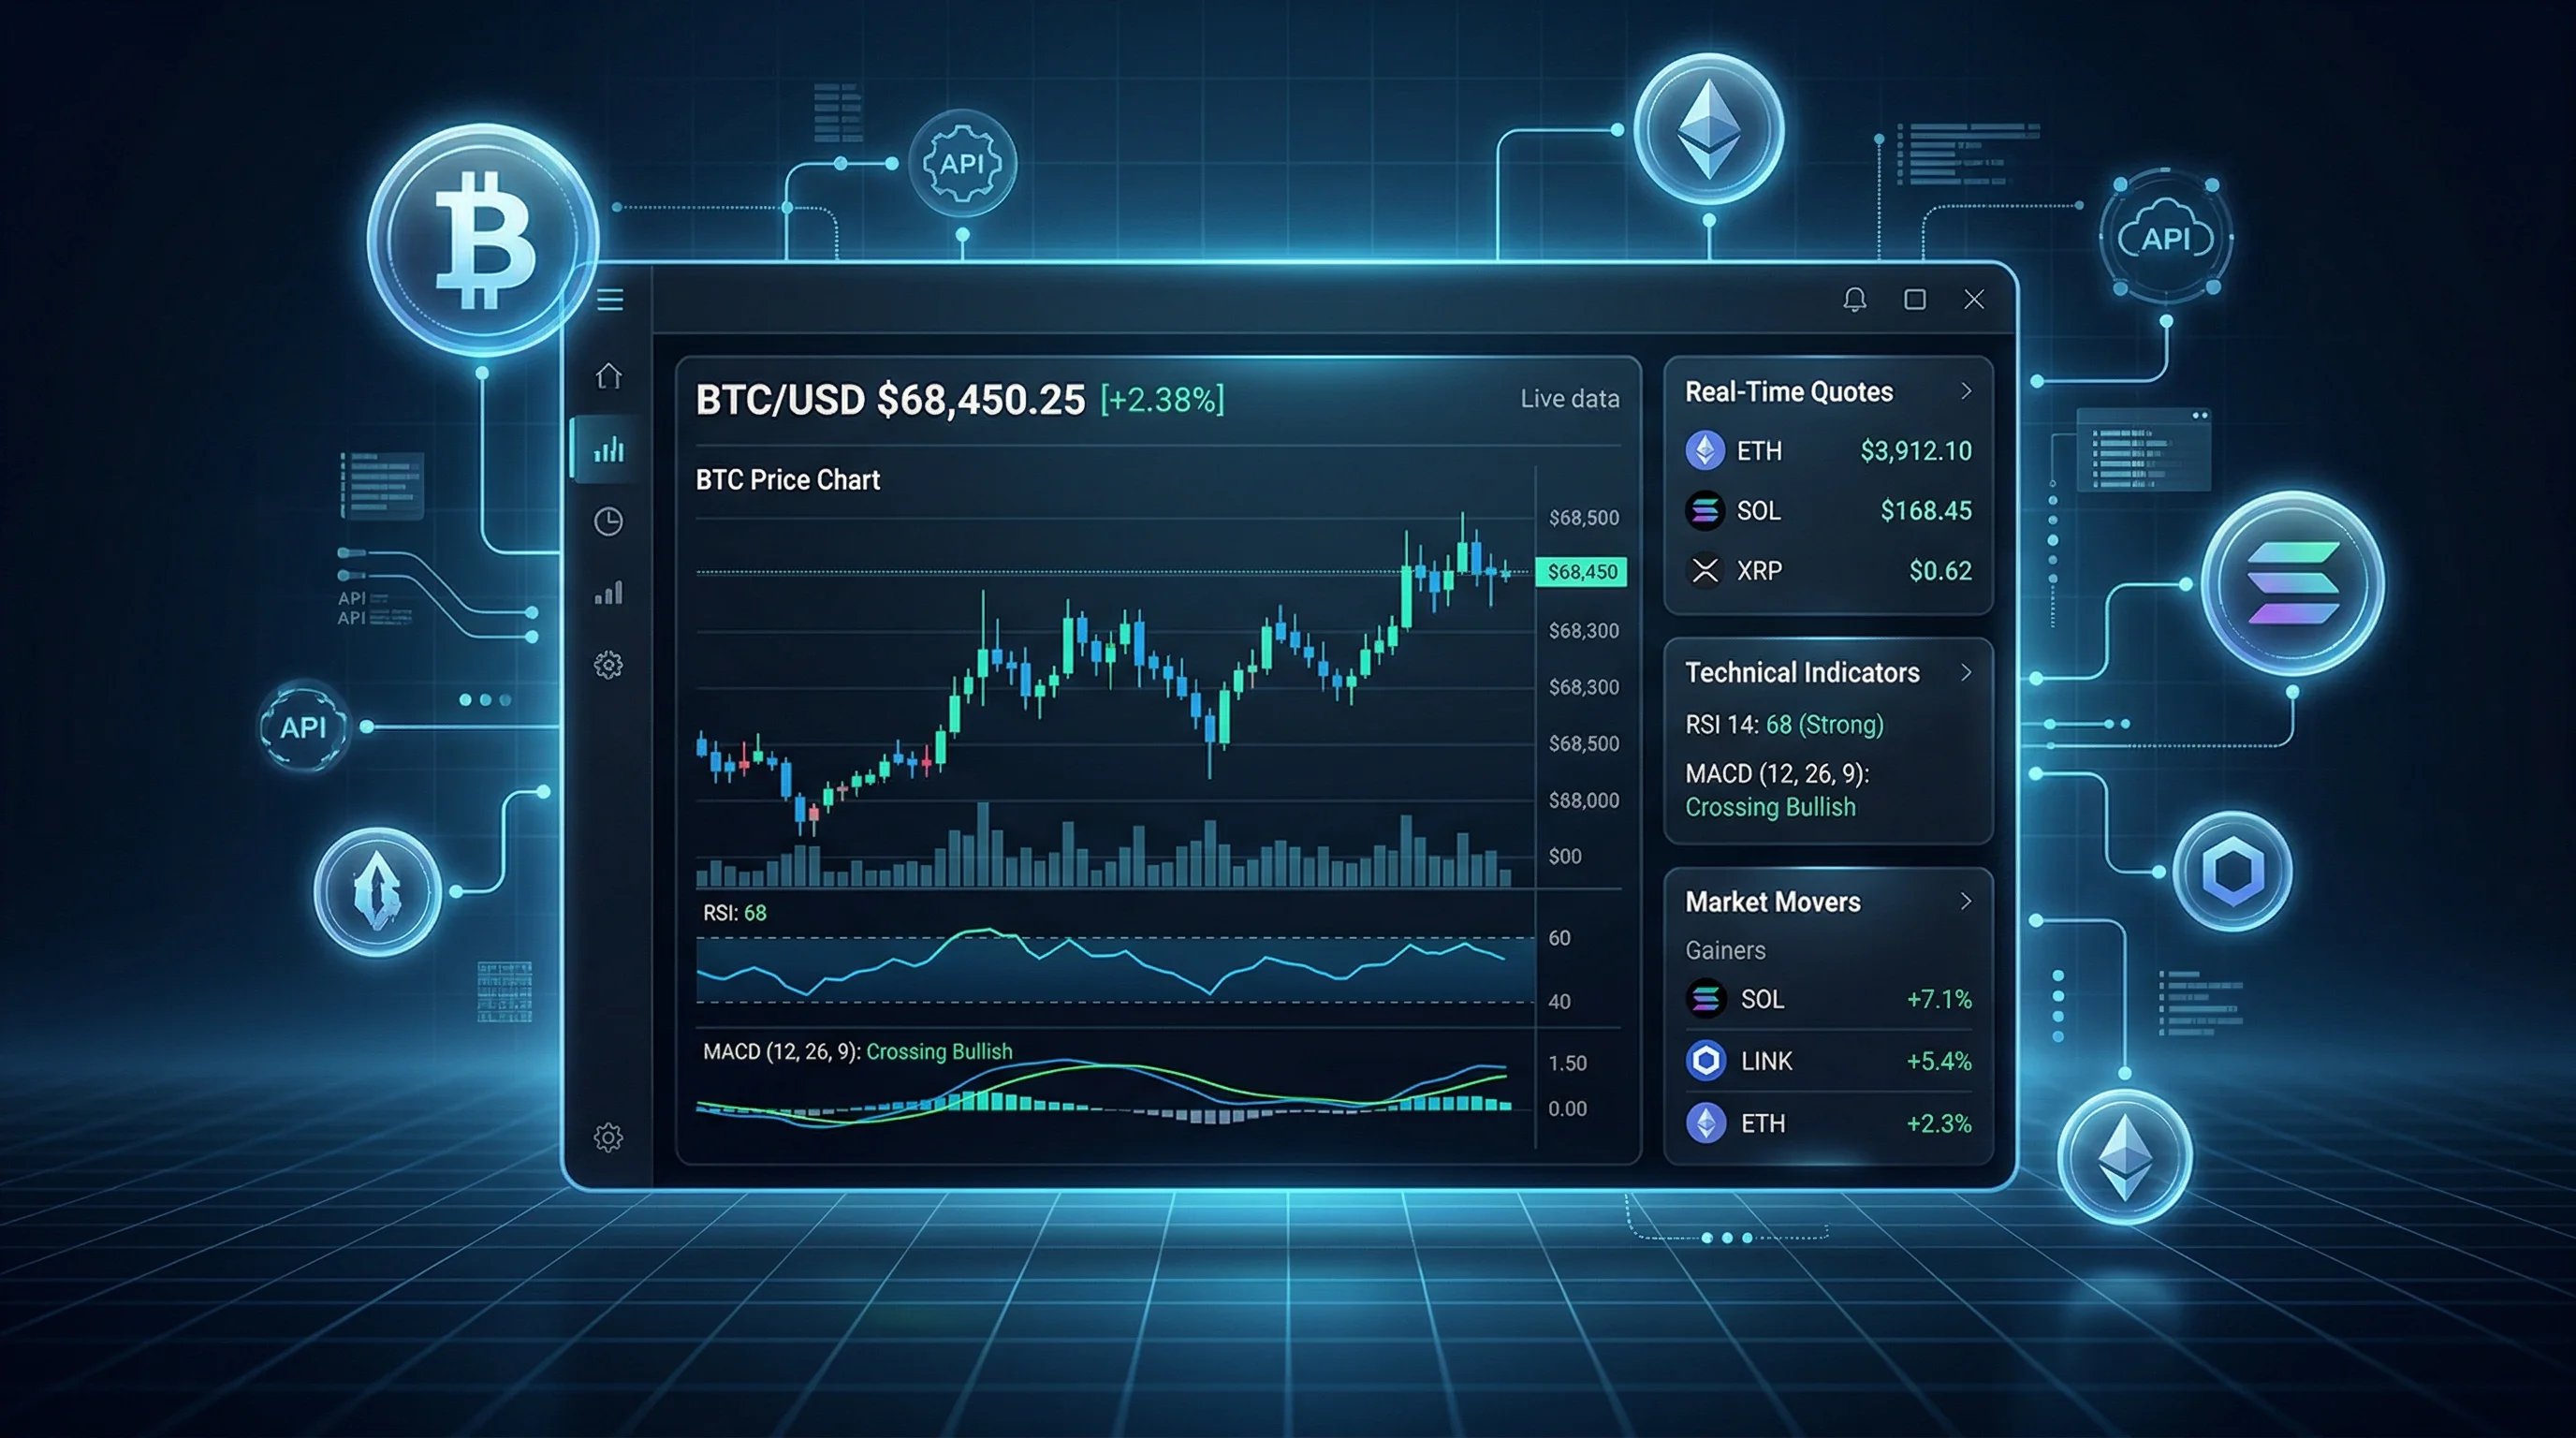
Step 2: Real-Time Quote — Current price, change percentage, volume, market cap, 52-week range, and bid/ask data.
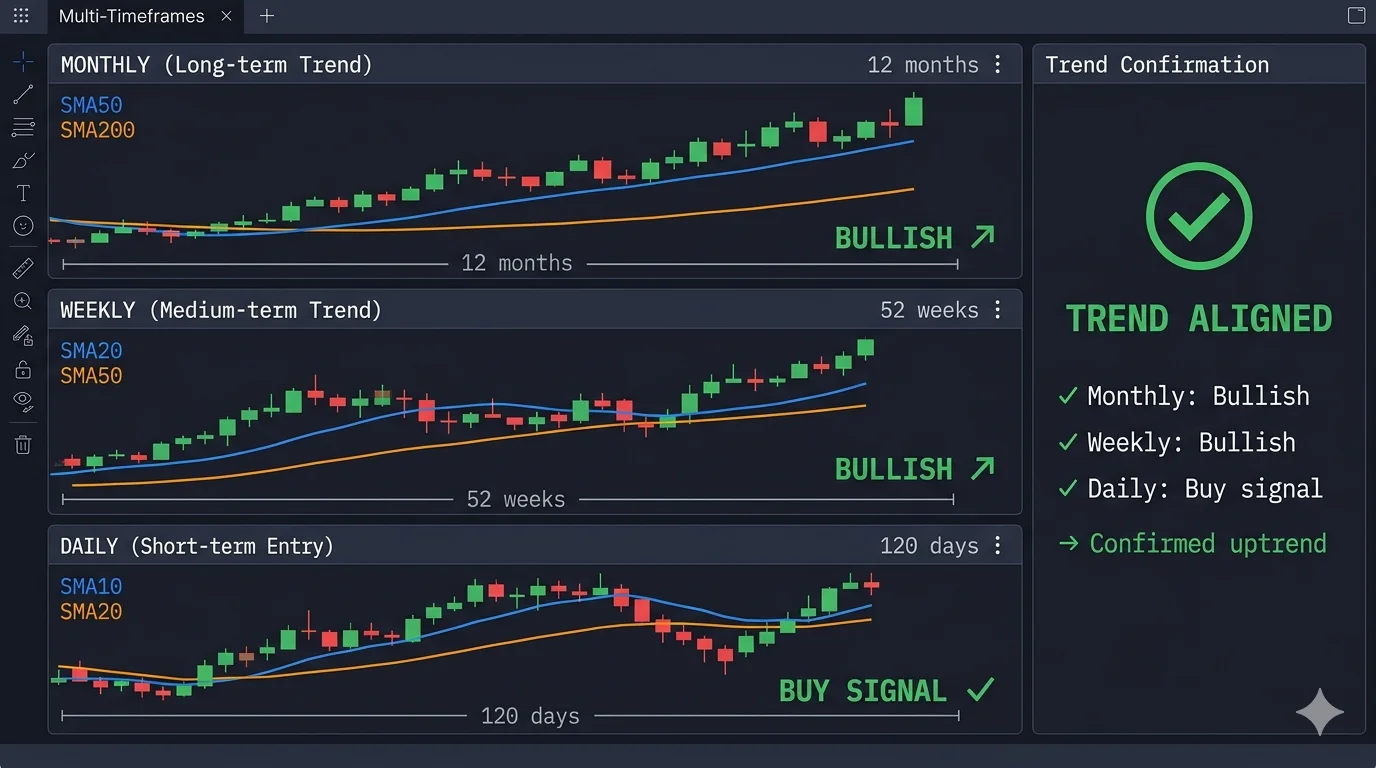
Step 3: Multi-Timeframe Charts — Three parallel data pulls:
- Daily (120 bars) — Medium-term trend analysis
- Weekly (52 bars) — Long-term direction and major support/resistance
- 60-minute (100 bars) — Short-term entry timing and intraday patterns
Step 4: Detailed Technical Analysis — Full indicator suite with multi-timeframe signal summary across 8 timeframes (1min through monthly), plus individual readings for RSI, MACD, ADX, and moving average systems.
Step 5: News Analysis — Recent 5-10 news items filtered by symbol, covering earnings reports, company announcements, industry developments, and regulatory changes.
Step 6: Calendar Events — Upcoming earnings releases, dividend dates, and corporate actions that may impact price.
Example: Analyzing a US Tech Stock
Help me analyze NVIDIA (NVDA) — is it a good time to buy?The AI generates a comprehensive report including:
- Technical score across all timeframes
- Key support at SMA50 and resistance at recent highs
- Upcoming earnings date and analyst expectations
- Position sizing recommendation based on your capital
- Clear risk-reward ratio with stop-loss and target levels
Daily Market Review: Track Sectors and Capital Flow
The market review workflow provides a systematic framework for daily market analysis, helping you identify hot sectors and discover investment opportunities.
What the Market Review Covers
A complete market review pulls data from 4 parallel sources:
- Top 50 Gainers — Strongest performers with volume and change data
- Top 50 Losers — Weakest stocks for sector weakness identification
- Most Active (30 stocks) — Highest volume for capital flow signals
- Unusual Volume (30 stocks) — Abnormal volume spikes indicating institutional activity
This data is then cross-referenced with:
- Market news (10-20 recent items) for catalyst identification
- Index quotes (e.g., S&P 500, Dow Jones, NASDAQ Composite) for broad market context
- Sector categorization to identify the top 3-5 hot sectors
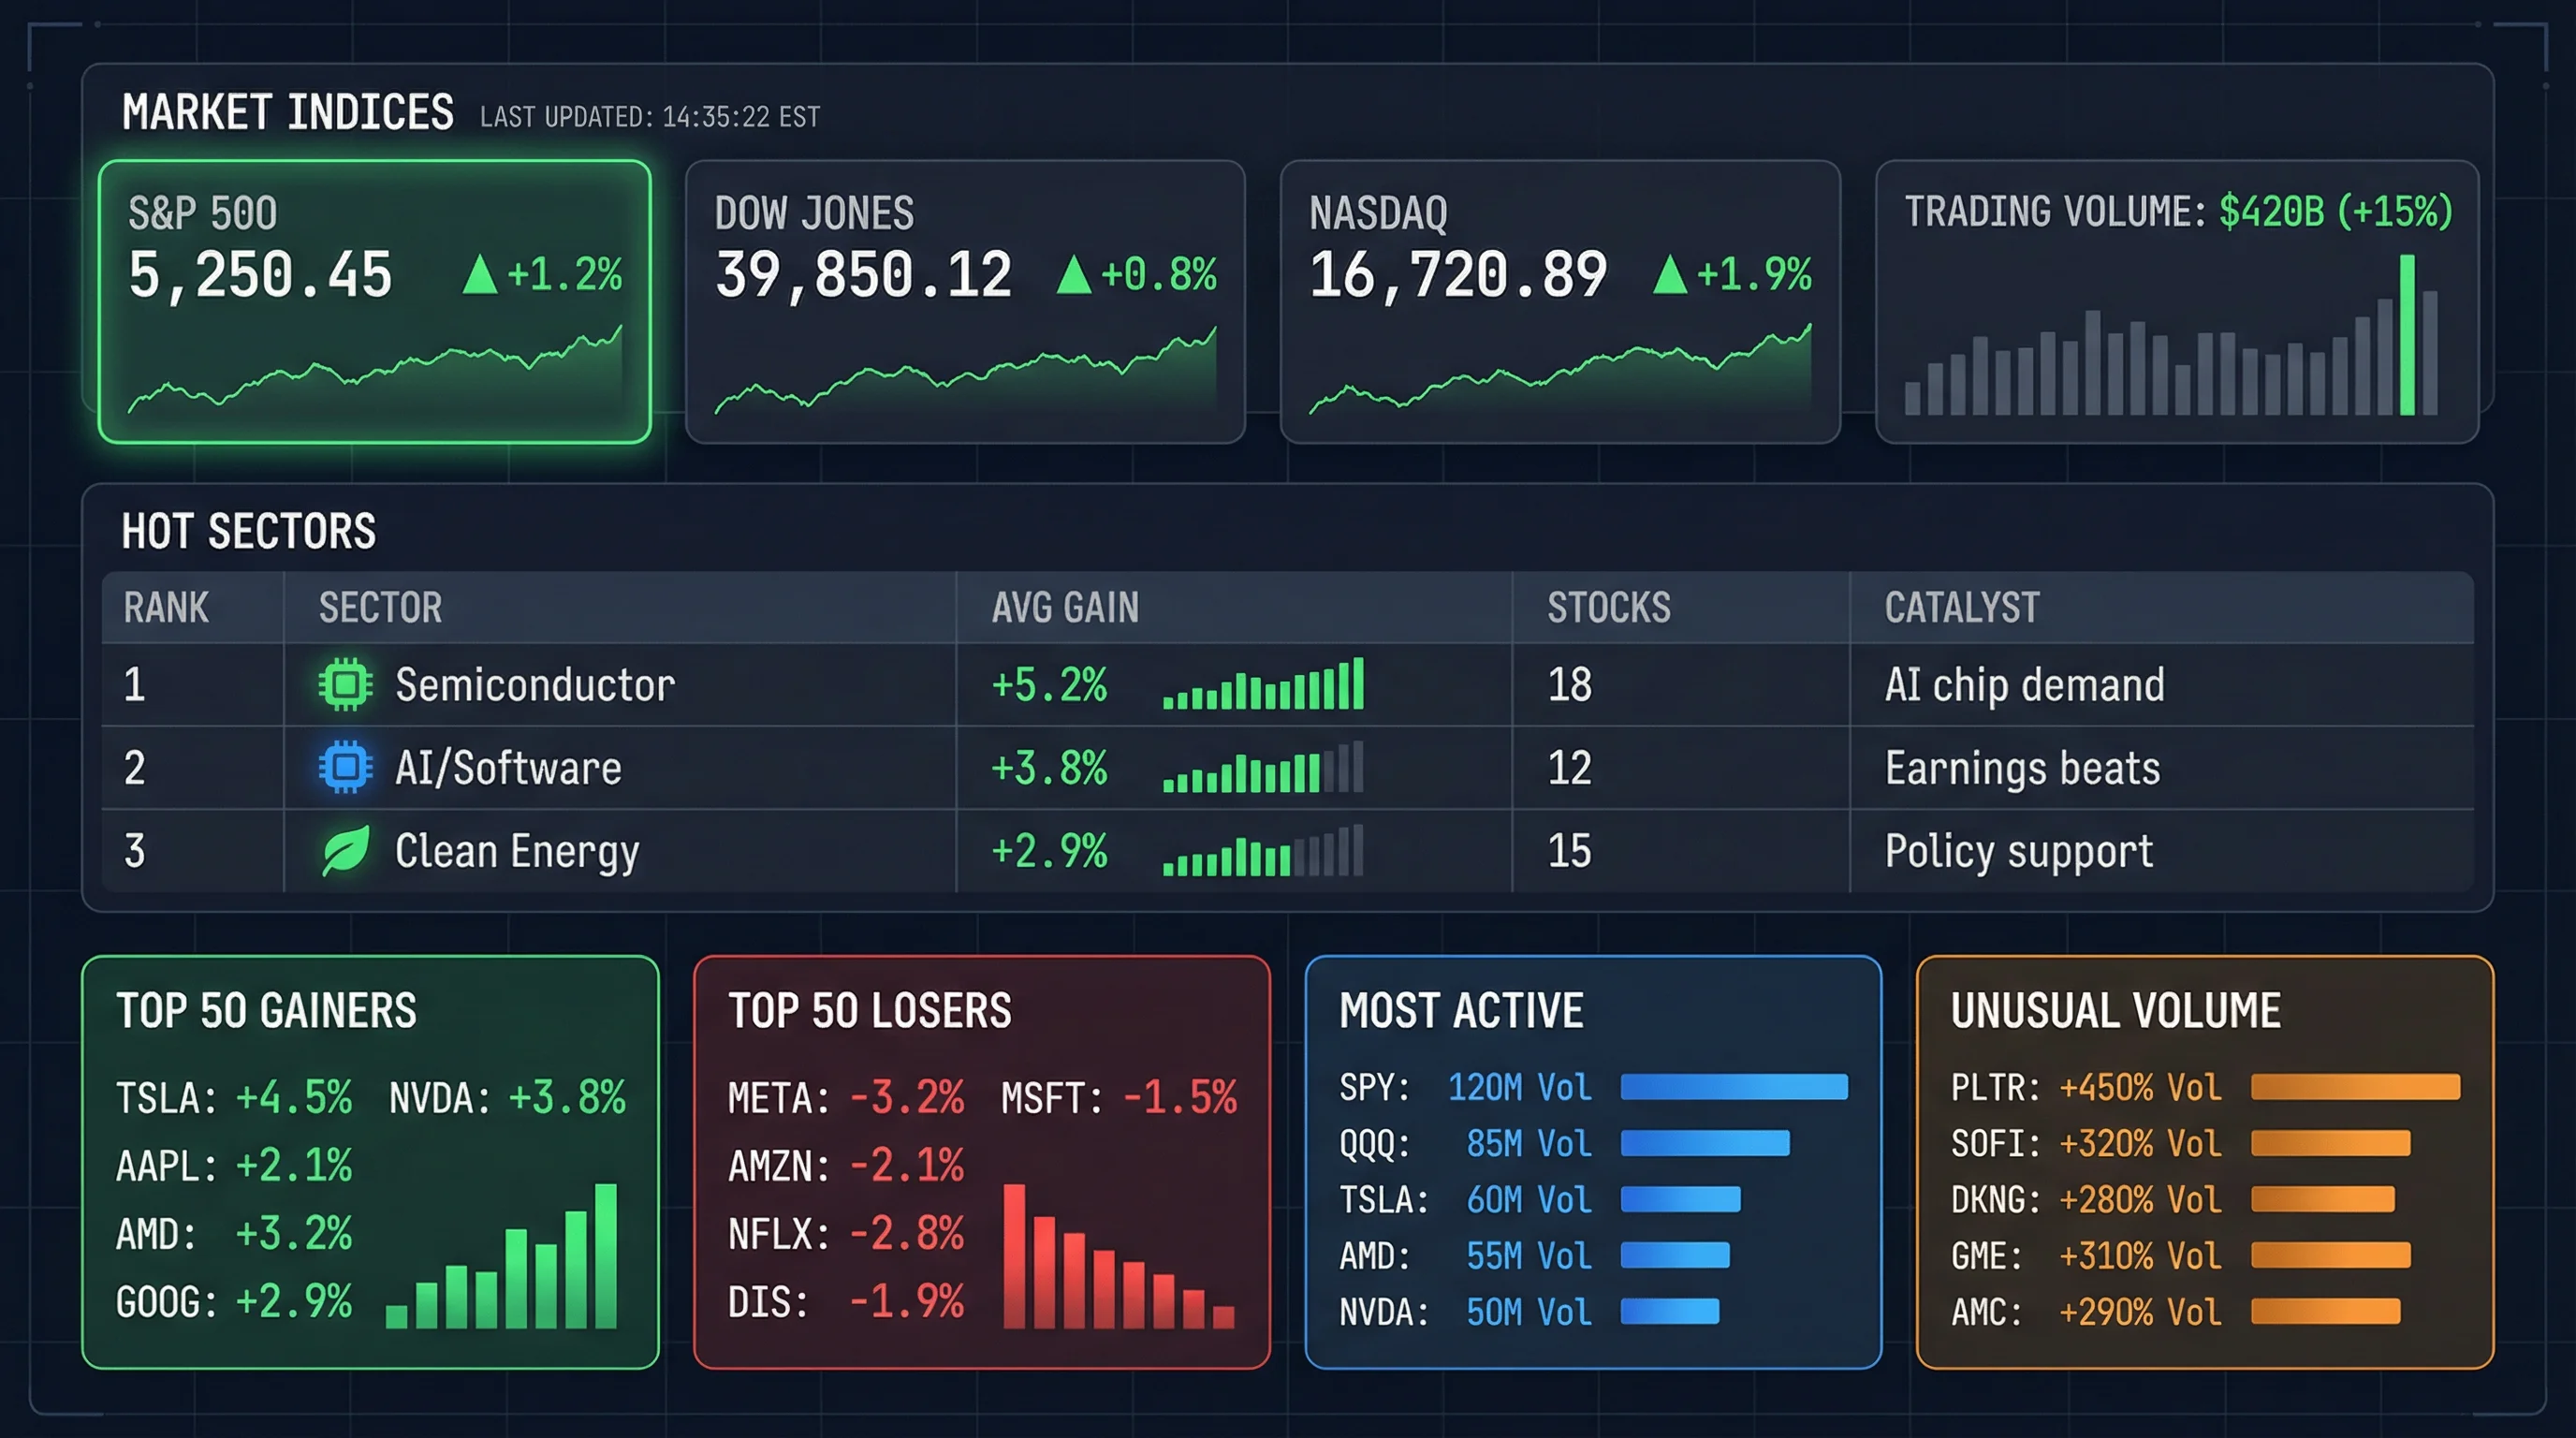
Reading the Market Review Report
The output follows a structured format:
# US Stock Market Review — 2026-03-11

## Market Overview
- S&P 500: +1.2% | Dow Jones: +0.8% | NASDAQ: +1.9%
- Advance/Decline: 3,200 up / 1,500 down
- Trading volume: $420 billion (+15% vs. previous)

## Hot Sectors (Ranked by strength)
| Rank | Sector        | Avg Gain | Stocks Count | Catalyst            |
|------|---------------|----------|-------------|---------------------|
| 1    | Semiconductor | +5.2%    | 18          | Strong chip demand  |
| 2    | AI/Software   | +3.8%    | 12          | Earnings beats     |
| 3    | Clean Energy  | +2.9%    | 15          | Policy support      |

## Investment Opportunities
- Semiconductor: AI chip demand surge, watch for pullback entries
- AI sector: Earnings momentum, focus on cloud computing leaders
Supported Markets for Review
You can run market reviews for any of these markets:
- United States:
market_code='america'— NYSE, NASDAQ - Europe:
market_code='uk',market_code='germany'— LSE, XETR - Asia:
market_code='japan',market_code='hongkong'— TSE, HKEX - Cryptocurrency:
asset_type='crypto'— All major exchanges
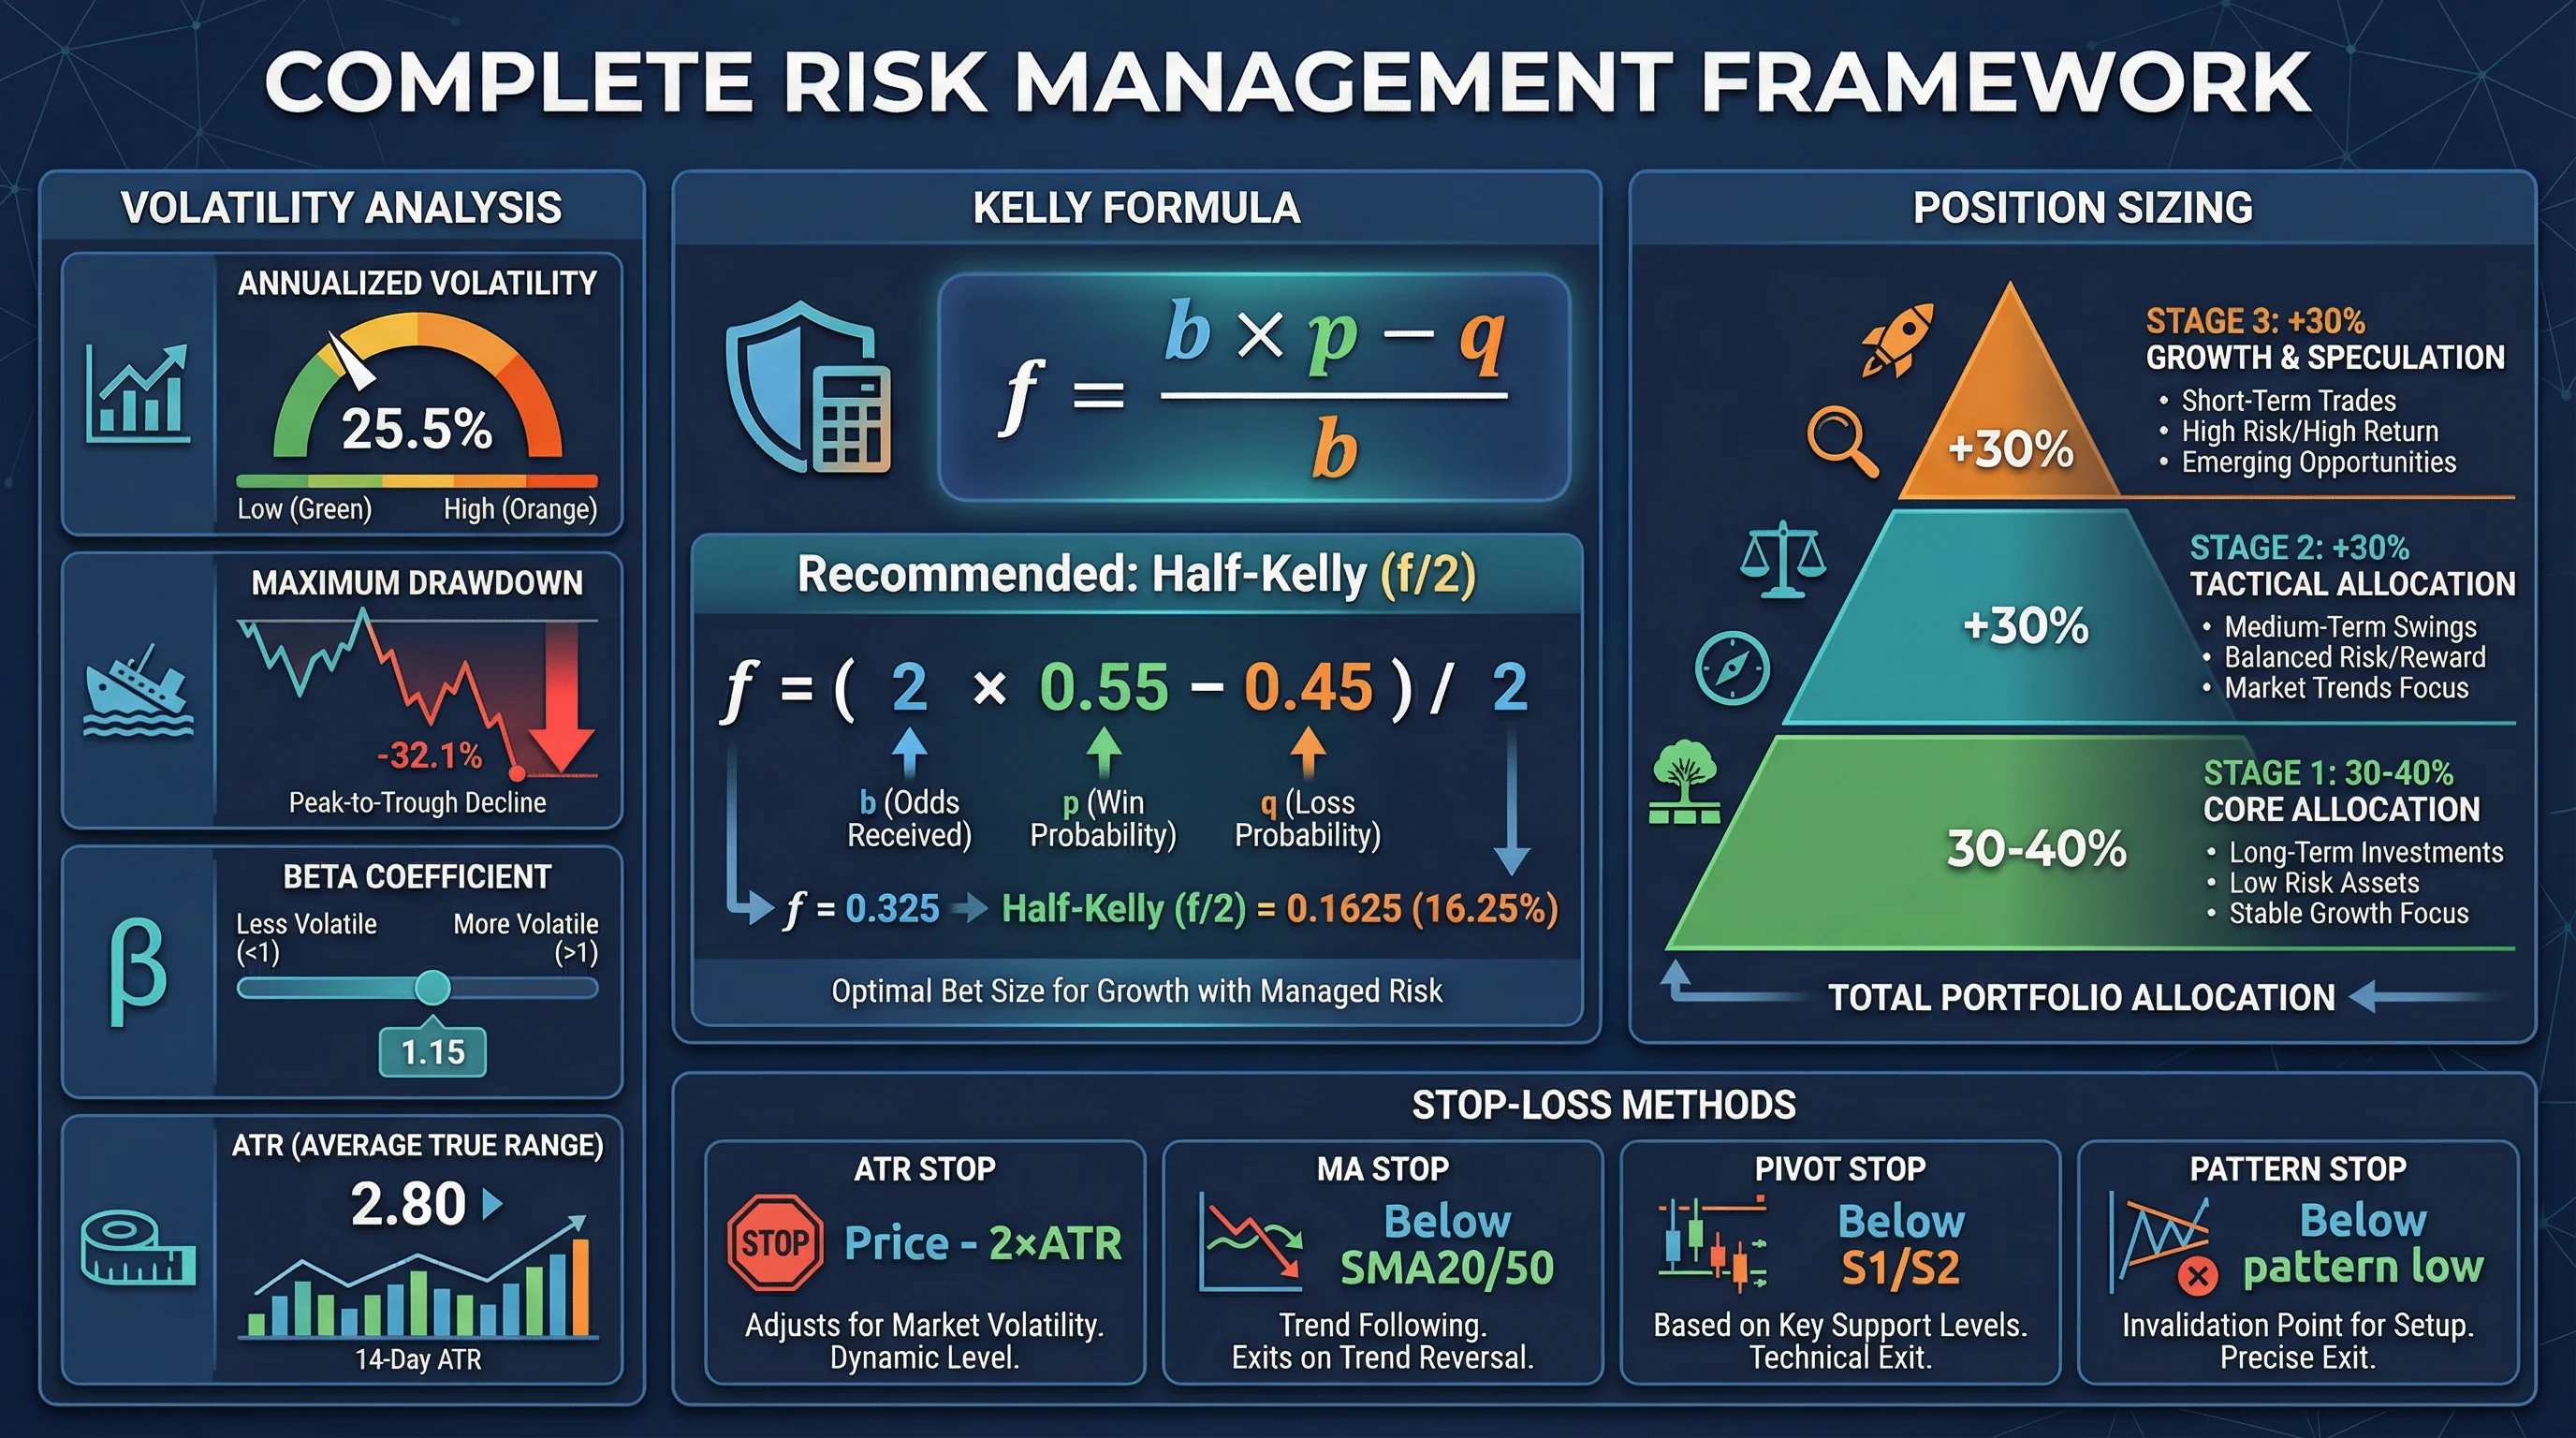
Risk Management: Position Sizing and Stop-Loss
Professional risk management is what separates profitable traders from the rest. The skill provides a complete risk assessment framework including volatility analysis, position sizing with Kelly Formula, and multi-method stop-loss calculation.
Volatility Analysis
The system calculates key risk metrics from 250 days of historical data:
- Annualized volatility — Daily return standard deviation × √252
- Maximum drawdown — Largest peak-to-trough decline in the period
- Beta coefficient — Stock’s volatility relative to the market
- Average True Range (ATR) — Average daily price range for dynamic stop-loss
Position Sizing with Kelly Formula
The Kelly Formula determines optimal position size based on your win rate and risk-reward ratio:
f = (b × p - q) / b
where: b = odds (reward/risk), p = win rate, q = 1 - p
Recommended: Use half-Kelly (f/2) for conservative approach
Volatility-adjusted alternative:
Recommended position % = Target daily volatility / Instrument daily volatility
Example: Target 2% daily volatility, stock has 4% → Max position = 50%
Staggered Entry Strategy
The skill recommends a 3-stage entry approach:
| Stage | Position Size | Trigger Condition |
|---|---|---|
| First Entry | 30-40% of total | Initial analysis confirms buy signal |
| Add Position 1 | +30% | Trend confirmation (e.g., break above resistance) |
| Add Position 2 | +30% | Breaks key technical level with volume |
Stop-Loss and Take-Profit Calculation
The system evaluates 4 stop-loss methods and recommends the most appropriate:
- ATR Stop: Current price − 2 × ATR (dynamic, adapts to volatility)
- Moving Average Stop: Below SMA20 or SMA50 support
- Pivot Point Stop: Below S1 or S2 support levels
- Pattern Stop: Below the low of the identified chart pattern
Risk-reward requirement: Minimum 1.5:1 ratio, ideally 2.0:1 or higher.
Example: Position Sizing for a $100,000 Portfolio
I have $100,000 capital and want to buy Apple (AAPL).
How much should I allocate?
The AI calculates:
- Stock’s annualized volatility (e.g., 28%)
- Optimal position size using half-Kelly formula
- Entry price, stop-loss at ATR-based level, and two take-profit targets
- Maximum potential loss: $2,000 (2% of total capital per trade)
Technical Pattern Recognition
The pattern recognition workflow identifies classic chart patterns and provides confidence-scored trading signals.
Supported Patterns
The skill’s pattern library covers the most reliable chart formations:
Reversal Patterns:
- Head and Shoulders / Inverse Head and Shoulders
- Double Top / Double Bottom
- Triple Top / Triple Bottom
- Rounding Bottom
Continuation Patterns:
- Bull Flag / Bear Flag
- Ascending / Descending Triangle
- Symmetrical Triangle
- Cup and Handle
Each pattern analysis includes:
- Pattern confidence score (0-100%)
- Historical success rate from the pattern library
- Measured price target based on pattern height
- Recommended entry, stop-loss, and take-profit levels
All 15 Analysis Workflows at a Glance
Here’s a complete reference of every workflow available in the skill:
Core Analysis Workflows
| Workflow | Use Case | Example Query |
|---|---|---|
deep-stock-analysis | Comprehensive single stock evaluation | ”Analyze Tesla for me” |
smart-screening | Multi-factor stock screening | ”Find strong tech stocks in US” |
fundamental-screening | Value/dividend screening | ”Find high-dividend US stocks with low PE” |
pattern-recognition | Chart pattern identification | ”What pattern is forming on AAPL?” |
multi-timeframe-analysis | Trend confirmation across D/W/M | ”Is Bitcoin in an uptrend?” |
Market and Sector Workflows
| Workflow | Use Case | Example Query |
|---|---|---|
market-review | Daily market recap and sector tracking | ”How was the US market today?” |
sector-rotation | Cross-sector performance comparison | ”Which sectors are strongest this month?” |
news-briefing | Financial news aggregation and analysis | ”Summarize today’s market news” |
Risk and Event Workflows
| Workflow | Use Case | Example Query |
|---|---|---|
risk-assessment | Position sizing and stop-loss planning | ”How much TSLA should I buy with $50k?” |
event-analysis | Earnings/policy impact analysis | ”How will the Fed meeting affect markets?” |
calendar-tracking | Upcoming earnings, dividends, IPOs | ”What earnings are coming next week?” |
Quote and Search Workflows
| Workflow | Use Case | Example Query |
|---|---|---|
symbol-search | Find instruments across markets | ”Find semiconductor ETFs” |
realtime-monitor | Interpret real-time quote data | ”What’s the current quote for BTC?” |
multi-symbol-analysis | Batch analysis of multiple instruments | ”Compare AAPL, MSFT, and GOOGL” |
exchange-overview | Exchange and market metadata | ”What exchanges are available in Asia?” |
Getting Real-Time Data (Optional)
Last Updated: March 13, 2026
The skill provides analysis frameworks and methodologies out of the box. For real-time market data to feed into these workflows, you can optionally connect the TradingView Data API:
Pricing Tiers (March 2026):
- Free tier: 500 requests/month — sufficient for daily analysis of 5-10 stocks
- Basic plan: $9.99/month for 10,000 requests — active daily screening and portfolio monitoring
- Pro plan: $49.99/month for 100,000 requests — full-time quantitative analysis and algorithmic trading
API Coverage:
- Instruments: 160,000+ across all asset classes
- Exchanges: 353+ including all major stock and crypto exchanges
- Data types: Real-time quotes (<50ms WebSocket latency), historical OHLCV data (8 timeframes), technical indicators, 136+ market leaderboards, financial news (8 market types), calendar events (earnings, dividends, IPOs)
- Performance: WebSocket latency <50ms, REST API updates every 1-5 seconds
- Distribution: Available via RapidAPI marketplace, serving 10,000+ developers
Best Practices for Using the Quant Skill
1. Start with Market Review
Begin each trading day with a market review to understand the broad context before analyzing individual stocks.
2. Use Multi-Timeframe Confirmation
Never rely on a single timeframe. The skill’s multi-timeframe analysis workflow checks daily, weekly, and monthly trends to confirm signals.
3. Always Apply Risk Management
Before entering any position, run the risk assessment workflow to determine appropriate position size and stop-loss levels. The golden rule: never risk more than 2% of total capital on a single trade.
4. Combine Technical and Fundamental Analysis
The smart screening workflow deliberately combines both approaches. Use fundamental screening to identify quality companies, then technical analysis to find optimal entry timing.
5. Verify with Pattern Recognition
After identifying a candidate, check for chart patterns that support your thesis. Pattern recognition with confidence scoring adds an additional layer of conviction.
Frequently Asked Questions
What is the OpenClaw TradingView Quant Skill?
The OpenClaw TradingView Quant Skill is an AI-powered quantitative investment analysis system providing 15 professional analysis workflows, a 100-point technical scoring model, and risk management frameworks. It covers stocks, crypto, forex, and futures across 8+ global markets including US (NYSE, NASDAQ), Europe, Asia, and cryptocurrency exchanges.
Do I need programming skills to use this skill?
No programming skills are needed. The skill works through natural language — simply describe what you want to analyze in plain English or Chinese, and the AI executes the appropriate workflow automatically. For example, ask “Help me screen strong tech stocks” or “Analyze BTC/USDT technical indicators.”
How accurate is the technical analysis scoring?
The 100-point scoring model is based on established quantitative methodologies used by professional analysts. It combines 5 dimensions (trend, momentum, patterns, support/resistance, sentiment) with weighted scoring. However, all analysis is for reference only — no model can predict markets with certainty. Always combine the skill’s analysis with your own judgment and risk management.
Can I customize the screening criteria?
Yes. You can specify any combination of technical criteria (RSI range, MACD status, volume conditions), fundamental criteria (PE ratio, ROE, market cap, dividend yield), and market scope (country, sector, asset type). The AI adapts the screening workflow to your specific requirements.
How does this compare to Bloomberg Terminal or other professional tools?
The skill provides methodology-level analysis frameworks similar to what professional quants use, at zero cost. While Bloomberg Terminal ($24,000/year) offers deeper data access and proprietary analytics, the OpenClaw Quant Skill delivers comparable analysis frameworks through AI, making professional-grade quantitative analysis accessible to individual investors. For real-time data, pair the skill with the TradingView Data API (free tier available).
Conclusion
Last Updated: March 13, 2026
The OpenClaw TradingView Quant Skill transforms AI assistants into professional quantitative analysis tools, providing 15 analysis workflows that cover the full investment analysis lifecycle — from market screening to risk management.
Key Statistics Summary:
- Installation: Single command, <30 seconds, zero configuration
- Workflows: 15 professional analysis frameworks
- Scoring model: 100-point system (trend 30pts, momentum 25pts, patterns 20pts, support/resistance 15pts, sentiment 10pts)
- Pattern recognition: 12+ classic patterns with confidence scoring (0-100%)
- Market coverage: 8+ global markets, 160,000+ instruments, 353+ crypto exchanges
- Risk management: Kelly Formula position sizing, ATR-based stop-loss, multi-method validation
- Cost: Free skill + optional TradingView API ($0-49.99/month depending on usage)
With support for 8+ global markets, a 100-point technical scoring model, pattern recognition with confidence scoring, and Kelly Formula position sizing, the skill delivers institutional-grade analysis frameworks through simple natural language conversations.
Get started in 30 seconds:
npx skills add ljsd666/openclaw-tradingview-quantThen ask your first question: “Help me screen strong stocks from the US technology sector” — and watch your AI assistant become your personal quantitative analyst.
For real-time market data integration, visit the TradingView Data API. For API usage tutorials, see our complete beginner’s guide.
The analysis and recommendations provided by this skill are for reference only and do not constitute investment advice. Investing involves risks; decisions should be made cautiously.
Frequently Asked Questions
The OpenClaw TradingView Quant Skill is an AI-powered quantitative investment analysis system providing professional analysis frameworks based on TradingView API data structures. Released in March 2026, it includes 15 pre-built analysis workflows, 8 reference methodology files, and 9 API integration examples. Installation: Single command 'npx skills add ljsd666/openclaw-tradingview-quant' (completes in <30 seconds). Core components: (1) Smart screening with 100-point scoring model across 5 dimensions (trend 30pts, momentum 25pts, patterns 20pts, support/resistance 15pts, sentiment 10pts); (2) Deep stock analysis combining 6 data sources (quotes, multi-timeframe charts, technical indicators, news, calendar events); (3) Risk management with Kelly Formula position sizing; (4) Pattern recognition for 12+ classic chart patterns with confidence scoring. Works via natural language queries - no programming required. Supports 8+ global markets including US (NYSE, NASDAQ), China (SSE, SZSE), Hong Kong (HKEX), Japan (TSE), plus 353+ crypto exchanges.
No API key required for the skill itself - install and use immediately with zero configuration. The skill provides 15 analysis frameworks, 100-point scoring methodology, pattern recognition algorithms, and risk management models that work standalone. Optional enhancement: Connect TradingView Data API for real-time market data. TradingView API pricing (March 2026): Free tier 500 requests/month (sufficient for analyzing 5-10 stocks daily), Basic plan $9.99/month for 10,000 requests (active daily screening), Pro plan $49.99/month for 100,000 requests (full-time quantitative analysis). The API covers 160,000+ instruments across NYSE, NASDAQ, HKEX, SSE, SZSE, TSE, 353+ crypto exchanges, with real-time quotes (<50ms WebSocket latency), historical OHLCV data (8 timeframes), technical indicators, 136+ market leaderboards, financial news (8 market types), and calendar events (earnings, dividends, IPOs). Skill works with or without API - frameworks apply to any data source.
The skill supports 8+ major global markets with comprehensive coverage: (1) China A-shares - Shanghai Stock Exchange (SSE), Shenzhen Stock Exchange (SZSE), Beijing Stock Exchange (BSE); (2) United States - New York Stock Exchange (NYSE), NASDAQ; (3) Hong Kong - Hong Kong Stock Exchange (HKEX); (4) Japan - Tokyo Stock Exchange (TSE); (5) South Korea - Korea Exchange (KRX); (6) Europe - London Stock Exchange (LSE), Euronext, Deutsche Börse (XETR); (7) Cryptocurrency - 353+ exchanges including Binance, Coinbase, Kraken, OKX, Bybit, Gate.io, MEXC, Deribit, KuCoin, HTX, Bitget; (8) Forex - all major currency pairs (EUR/USD, GBP/USD, USD/JPY, etc.), minor pairs, exotic pairs; (9) Futures - commodity futures (gold, oil, agricultural), index futures (S&P 500, NASDAQ 100), currency futures. Total coverage: 160,000+ trading instruments. Analysis frameworks (technical indicators, pattern recognition, risk management, multi-timeframe analysis) work consistently across all markets and asset types.
Traditional stock screeners provide static filtering (e.g., 'PE < 15, ROE > 10%') returning simple lists. OpenClaw Quant Skill delivers AI-powered comprehensive analysis with 5 key differentiators: (1) Multi-factor scoring - 100-point system across 5 dimensions (trend strength 30pts, momentum 25pts, pattern recognition 20pts, support/resistance 15pts, market sentiment 10pts) vs binary pass/fail filtering; (2) Multi-timeframe analysis - validates signals across daily, weekly, monthly charts simultaneously vs single timeframe; (3) Pattern recognition - identifies 12+ classic chart patterns (head & shoulders, double bottom, flags, triangles) with confidence scoring (0-100%) and historical success rates; (4) News sentiment correlation - integrates recent news analysis with technical signals to identify catalysts; (5) Professional risk management - Kelly Formula position sizing, ATR-based stop-loss calculation, risk-reward ratio validation (minimum 1.5:1), staggered entry strategies (3-stage: 30-40% initial, +30% on confirmation, +30% on breakout). Output format: Comprehensive reports with actionable trading recommendations including entry prices, stop-loss levels, target prices, position sizing, and risk metrics - not just filtered symbol lists.
Yes, full support for cryptocurrency and forex analysis with identical professional frameworks. Cryptocurrency coverage: 353+ exchanges including Binance, Coinbase, Kraken, Bitfinex, OKX, Bybit, Gate.io, MEXC, Deribit, KuCoin, HTX (Huobi), Bitget, and 340+ more. Supported crypto assets: Bitcoin (BTC), Ethereum (ETH), major altcoins, DeFi tokens, stablecoins, NFT tokens. Unique crypto features: 20 types of cryptocurrency leaderboards (highest TVL, DeFi rankings, top gainers/losers, most active, new listings, trending coins). Forex coverage: All major pairs (EUR/USD, GBP/USD, USD/JPY, USD/CHF, AUD/USD, USD/CAD, NZD/USD), minor pairs (EUR/GBP, EUR/JPY, GBP/JPY), exotic pairs (USD/TRY, USD/ZAR, USD/MXN). Analysis capabilities: Same technical analysis frameworks (RSI, MACD, moving averages, ADX, Stochastic), pattern recognition (12+ patterns with confidence scoring), multi-timeframe validation (1m, 5m, 15m, 30m, 1h, 4h, daily, weekly, monthly), risk management (Kelly Formula position sizing, ATR stop-loss, volatility analysis), and 100-point scoring model apply across all asset classes. Simply specify asset type in query: 'Analyze BTC/USDT' or 'Screen strong forex pairs'.
The skill analyzes a comprehensive suite of technical indicators organized into 5 categories with weighted scoring: (1) Trend indicators (30-point weight) - Simple Moving Averages (SMA20, SMA50, SMA200), Exponential Moving Averages (EMA12, EMA26), MACD (Moving Average Convergence Divergence with signal line and histogram), ADX (Average Directional Index for trend strength measurement, threshold: ADX>25 indicates strong trend); (2) Momentum indicators (25-point weight) - RSI (Relative Strength Index, optimal range 40-70, overbought >70, oversold <30), Stochastic Oscillator (%K and %D lines, crossover signals), CCI (Commodity Channel Index), Williams %R (momentum indicator ranging -100 to 0); (3) Volume indicators (included in sentiment 10pts) - Volume analysis (comparing current vs average volume), MFI (Money Flow Index combining price and volume); (4) Support/Resistance levels (15-point weight) - Pivot Points (P, R1, R2, R3, S1, S2, S3 calculated from previous period high/low/close), Fibonacci retracements (23.6%, 38.2%, 50%, 61.8%, 78.6% levels); (5) Volatility indicators (risk assessment) - ATR (Average True Range for stop-loss calculation), Beta (stock volatility vs market), Bollinger Bands (price envelope with 2 standard deviations). Integration: All indicators combined into 100-point scoring model providing comprehensive technical assessment across 5 dimensions with specific point allocations per category.
Installation is a single-command process taking under 30 seconds with zero configuration required. Step 1: Open terminal and run 'npx skills add ljsd666/openclaw-tradingview-quant'. Step 2: Installation automatically downloads skill package including 15 workflow files (smart-screening.md, deep-stock-analysis.md, market-review.md, pattern-recognition.md, risk-assessment.md, sector-rotation.md, event-analysis.md, multi-timeframe-analysis.md, fundamental-screening.md, news-briefing.md, calendar-tracking.md, symbol-search.md, realtime-monitor.md, multi-symbol-analysis.md, exchange-overview.md), 8 reference files (api-documentation.md, technical-analysis.md, pattern-library.md, risk-management.md, us-stock-examples.md, plus 4 more), and 9 API integration examples. Step 3: Verify installation by checking project directory for 'openclaw-tradingview-quant/' folder. Step 4: Start using immediately - no API keys, no configuration files, no dependencies. Compatible with: Any AI assistant supporting OpenClaw skills format including Claude, ChatGPT, and compatible platforms. Usage: Simply ask natural language questions like 'Screen strong tech stocks' or 'Analyze AAPL' - skill activates automatically. Installation requirements: Node.js with npx (comes with Node.js 5.2+), internet connection for package download. Total installation time: Typically 15-30 seconds depending on network speed.