Executive Summary
Last Updated: March 24, 2026
A real-time crypto market dashboard is a web or mobile interface that combines symbol discovery, live quotes, OHLCV candles, technical analysis, and market news into a single workflow. To build one with an API, you need five core data blocks: symbol discovery, live quotes, OHLCV candles, technical analysis, and news.
This article is for developers building crypto dashboards, trading terminals, portfolio trackers, alert systems, or internal analytics tools. You will learn how to find valid exchange symbols, fetch Bitcoin and altcoin prices, render candles, add momentum signals, and surface market movers from a single API family.
Key Definition: A crypto market dashboard is an application layer that turns market data endpoints into searchable watchlists, charts, signal panels, news feeds, and market movers views.
Key takeaways:
- Use
GET /api/search/market/{query}andGET /api/metadata/exchangesto discover valid crypto symbols - Use
GET /api/quote/{symbol}for watchlists and price cards - Use
GET /api/price/{symbol}for OHLCV charts - Use
GET /api/ta/{symbol}andGET /api/ta/{symbol}/indicatorsfor technical signals - Use
GET /api/newsandGET /api/leaderboard/cryptofor market context and discovery
What you will build:
- A searchable crypto universe using exchange metadata
- A real-time watchlist for symbols like
BINANCE:BTCUSDTandBINANCE:ETHUSDT - A chart-ready OHLCV feed for hourly, daily, or weekly candles
- A technical analysis panel with signal summaries and indicators
- A crypto news and leaderboard module for market context
Key Takeaway: The TradingView Data API already exposes the endpoints needed for a production-style crypto dashboard:
GET /api/search/market/{query},GET /api/quote/{symbol},GET /api/price/{symbol},GET /api/ta/{symbol},GET /api/news, andGET /api/leaderboard/crypto. You do not need to stitch together multiple providers just to cover search, charts, indicators, and headlines.
Why Use an API for Crypto Market Data?
Cryptocurrency products move fast, and your application needs data that is structured, searchable, and consistent across exchanges. Scraping exchange pages or manually wiring multiple sources creates brittle logic, inconsistent symbol naming, and maintenance risk.
A well-designed crypto market data API solves three problems at once:
- Symbol normalization: Use exchange-prefixed symbols such as
BINANCE:BTCUSDT - Data consistency: Pull quotes, candles, and signals in JSON instead of parsing HTML
- Product speed: Ship dashboards, alerts, and watchlists faster with reusable endpoints
At a practical level, the TradingView Data API covers real-time quotes, candlestick data, technical analysis, financial news, market leaderboards, and exchange metadata. The exchange coverage spans 353+ exchanges, which is especially useful for crypto discovery workflows.
If you are new to the platform, start with the broader TradingView API tutorial. If you want a Python-first integration path, the Python stock market API integration guide is also useful because the request pattern is identical for crypto symbols.
The Crypto API Endpoints You Actually Need
Here is the practical endpoint stack for a crypto dashboard.
| Use case | Endpoint | Why it matters |
|---|---|---|
| Find symbols | GET /api/search/market/{query} | Lets users search BTC, ETH, SOL, or exchange pairs |
| Get live price | GET /api/quote/{symbol} | Returns current price, change, volume, bid/ask, and more |
| Load chart data | GET /api/price/{symbol} | Returns OHLCV candles for 1, 5, 15, 30, 60, 240, D, W, and M |
| Get signal summary | GET /api/ta/{symbol} | Returns Buy, Sell, or Neutral style technical summary |
| Get indicator details | GET /api/ta/{symbol}/indicators | Adds RSI, MACD, Stoch, CCI, ADX, moving averages, and pivot data |
| Pull news | GET /api/news?market=crypto&lang=en | Adds narrative context to price moves |
| Show movers | GET /api/leaderboard/crypto | Builds gainers, losers, and overview widgets |
| Discover exchanges | GET /api/metadata/exchanges | Helps generate symbol selectors and exchange filters |
That endpoint mix is enough to build most crypto products:
- A portfolio tracker
- A Bitcoin and altcoin dashboard
- A market movers board
- A technical analysis terminal
- A news-aware alerting tool
Here is the simplest way to map those endpoints to actual UI components:
| Dashboard component | Primary endpoint | Main output |
|---|---|---|
| Symbol picker | GET /api/search/market/{query} | Searchable exchange-prefixed symbols |
| Exchange selector | GET /api/metadata/exchanges | Exchange names, codes, and categories |
| Watchlist card | GET /api/quote/{symbol} | Price, change, volume, bid/ask |
| Chart panel | GET /api/price/{symbol} | OHLCV candles across multiple timeframes |
| Signal card | GET /api/ta/{symbol} | Buy, Sell, or Neutral summary |
| Indicator drawer | GET /api/ta/{symbol}/indicators | RSI, MACD, ADX, moving averages, pivots |
| News panel | GET /api/news?market=crypto&lang=en | Headlines and market context |
| Movers widget | GET /api/leaderboard/crypto | Gainers, losers, DeFi views, TVL rankings |
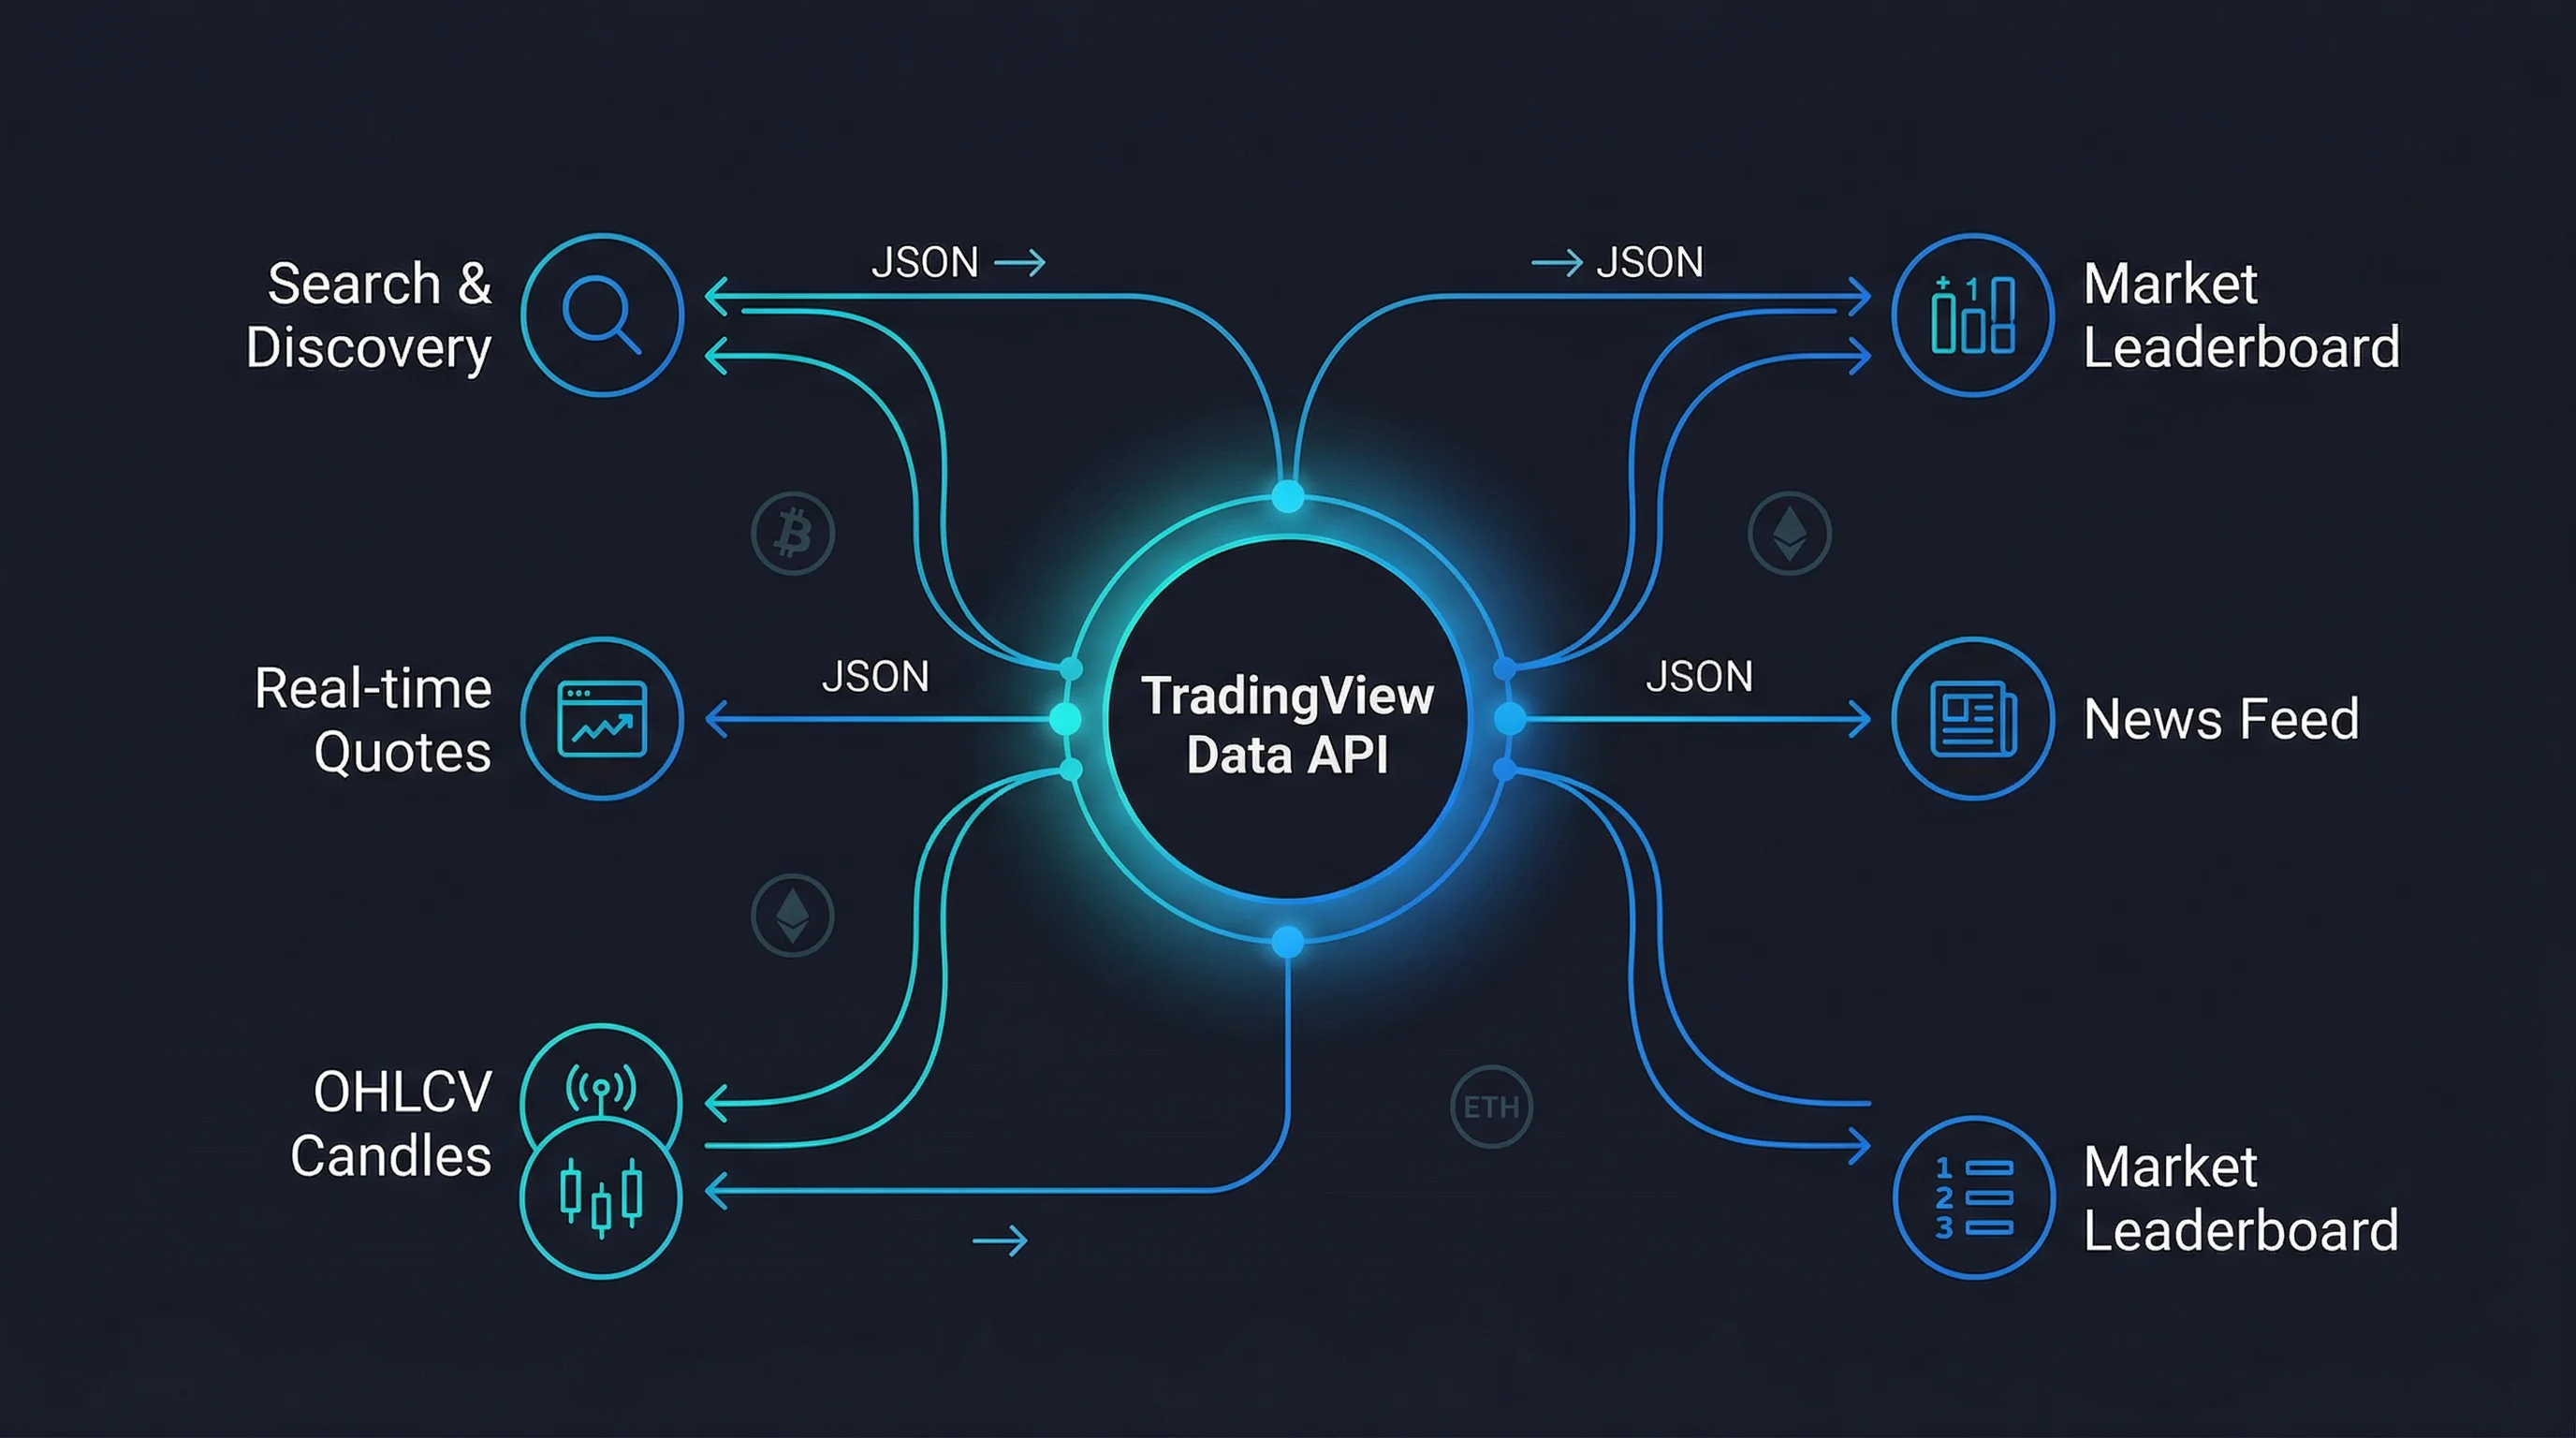 Figure: The six core API endpoints that power a crypto market dashboard
The API is exposed through RapidAPI and uses standard header-based authentication.
curl --request GET \
  --url 'https://tradingview-data1.p.rapidapi.com/api/quote/BINANCE:BTCUSDT?session=regular&fields=all' \
  --header 'x-rapidapi-host: tradingview-data1.p.rapidapi.com' \
  --header 'x-rapidapi-key: YOUR_API_KEY_HERE'
Use the following base URL in your application:
https://tradingview-data1.p.rapidapi.comImportant: Keep your API key on the server side. Do not expose it in frontend JavaScript shipped to browsers.
Step 1: Discover Crypto Symbols and Exchanges
The first problem in any crypto application is not charting. It is finding valid symbols.
Symbol search is available through GET /api/search/market/{query} with an optional filter=crypto. The API also exposes GET /api/metadata/exchanges, which returns a comprehensive exchange mapping with fields such as exchange name, code, group, and provider identifiers.
That means you can build a robust symbol picker instead of hardcoding exchange lists.
Search for Bitcoin Markets
curl --request GET \
  --url 'https://tradingview-data1.p.rapidapi.com/api/search/market/BTC?filter=crypto&offset=0' \
  --header 'x-rapidapi-host: tradingview-data1.p.rapidapi.com' \
  --header 'x-rapidapi-key: YOUR_API_KEY_HERE'
Load Exchange Metadata
curl --request GET \
  --url 'https://tradingview-data1.p.rapidapi.com/api/metadata/exchanges' \
  --header 'x-rapidapi-host: tradingview-data1.p.rapidapi.com' \
  --header 'x-rapidapi-key: YOUR_API_KEY_HERE'
You can use exchange metadata to:
- Filter markets by exchange family
- Build dropdowns for Binance, Coinbase, Kraken, OKX, Bybit, Gate, MEXC, and Deribit
- Validate symbol format before sending a request
- Store exchange labels while using compact codes like
BINANCEorOKXin your API calls
Pro Tip: If your frontend needs a local lookup table, cache the response from
/api/metadata/exchangeson first load. This gives you exchange and market-related reference data that can drive selectors and validation logic without repeated API calls.
Step 2: Fetch Real-Time Crypto Quotes
Once the user picks a symbol, call GET /api/quote/{symbol}. This endpoint accepts three key request parts:
symbolin the path, such asBINANCE:BTCUSDTsessionin the query, defaulting toregularfieldsin the query, defaulting toall
For crypto dashboards, this endpoint is the core of your watchlist card.
Bitcoin Quote Example
curl --request GET \
  --url 'https://tradingview-data1.p.rapidapi.com/api/quote/BINANCE:BTCUSDT?session=regular&fields=all' \
  --header 'x-rapidapi-host: tradingview-data1.p.rapidapi.com' \
  --header 'x-rapidapi-key: YOUR_API_KEY_HERE'
A typical crypto quote card can show:
- Last price
- Absolute change
- Percentage change
- Session high and low
- Open price
- Volume
- Bid and ask
JavaScript Helper for Quotes
const API_HOST = 'tradingview-data1.p.rapidapi.com';
const API_KEY = process.env.RAPIDAPI_KEY;

async function getQuote(symbol) {
  const url = `https://${API_HOST}/api/quote/${encodeURIComponent(symbol)}?session=regular&fields=all`;

  const response = await fetch(url, {
    method: 'GET',
    headers: {
      'x-rapidapi-host': API_HOST,
      'x-rapidapi-key': API_KEY,
    },
  });

  if (!response.ok) {
    throw new Error(`Quote request failed with status ${response.status}`);
  }

  return response.json();
}
If you are rendering a multi-coin watchlist, the API also exposes a batch quote endpoint at POST /api/quote/batch, which is a better fit than many sequential single-symbol requests.
Step 3: Load OHLCV Candlestick Data for Charts
A dashboard is not complete with quote tiles alone. Users also want chart context.
The API provides GET /api/price/{symbol} for OHLCV candlestick data. It supports timeframes 1, 5, 15, 30, 60, 240, D, W, and M, plus a range parameter for the number of bars to return.
Hourly BTC Candles for the Last 7 Days
The following request fetches 168 hourly candles, which equals 7 days × 24 hours.
curl --request GET \
  --url 'https://tradingview-data1.p.rapidapi.com/api/price/BINANCE:BTCUSDT?timeframe=60&range=168' \
  --header 'x-rapidapi-host: tradingview-data1.p.rapidapi.com' \
  --header 'x-rapidapi-key: YOUR_API_KEY_HERE'
This response is ideal for:
- Candlestick charts
- Volume bars
- Rolling averages
- Local indicator calculations
- Mini sparkline previews in watchlists
JavaScript Helper for Candle Data
async function getCandles(symbol, timeframe = '60', range = 168) {
  const url = new URL(`https://${API_HOST}/api/price/${encodeURIComponent(symbol)}`);
  url.searchParams.set('timeframe', timeframe);
  url.searchParams.set('range', String(range));

  const response = await fetch(url, {
    headers: {
      'x-rapidapi-host': API_HOST,
      'x-rapidapi-key': API_KEY,
    },
  });

  if (!response.ok) {
    throw new Error(`Price request failed with status ${response.status}`);
  }

  return response.json();
}
A practical mapping for crypto UI components looks like this:
| UI widget | Timeframe | Range |
|---|---|---|
| Intraday scalping panel | 1 or 5 | 120 |
| Daily market dashboard | 60 | 168 |
| Swing trade overview | 240 | 180 |
| Long-term investor view | D | 365 |
| Trend comparison | W | 104 |
Step 4: Add Technical Analysis Signals
Price is raw input. A professional dashboard also explains what the market structure looks like.
The API exposes two levels of technical analysis:
GET /api/ta/{symbol}for a summary signalGET /api/ta/{symbol}/indicatorsfor detailed indicator values
That combination is powerful because it supports both simple and advanced products.
Technical Summary Example
curl --request GET \
  --url 'https://tradingview-data1.p.rapidapi.com/api/ta/BINANCE:BTCUSDT' \
  --header 'x-rapidapi-host: tradingview-data1.p.rapidapi.com' \
  --header 'x-rapidapi-key: YOUR_API_KEY_HERE'
Indicator Detail Example
curl --request GET \
  --url 'https://tradingview-data1.p.rapidapi.com/api/ta/BINANCE:BTCUSDT/indicators' \
  --header 'x-rapidapi-host: tradingview-data1.p.rapidapi.com' \
  --header 'x-rapidapi-key: YOUR_API_KEY_HERE'
Based on the API schema, the indicators endpoint can expose data such as:
- RSI for momentum balance
- MACD for trend and momentum crossover context
- Stochastic for short-term overbought and oversold conditions
- CCI for deviation from average price behavior
- ADX for trend strength
- EMA/SMA values for moving-average structure
- Pivot points for support and resistance planning
This is ideal for dashboards that need:
- Buy/Sell/Neutral badges
- Momentum heatmaps
- Multi-panel signal cards
- Risk dashboards for BTC, ETH, SOL, and other major pairs
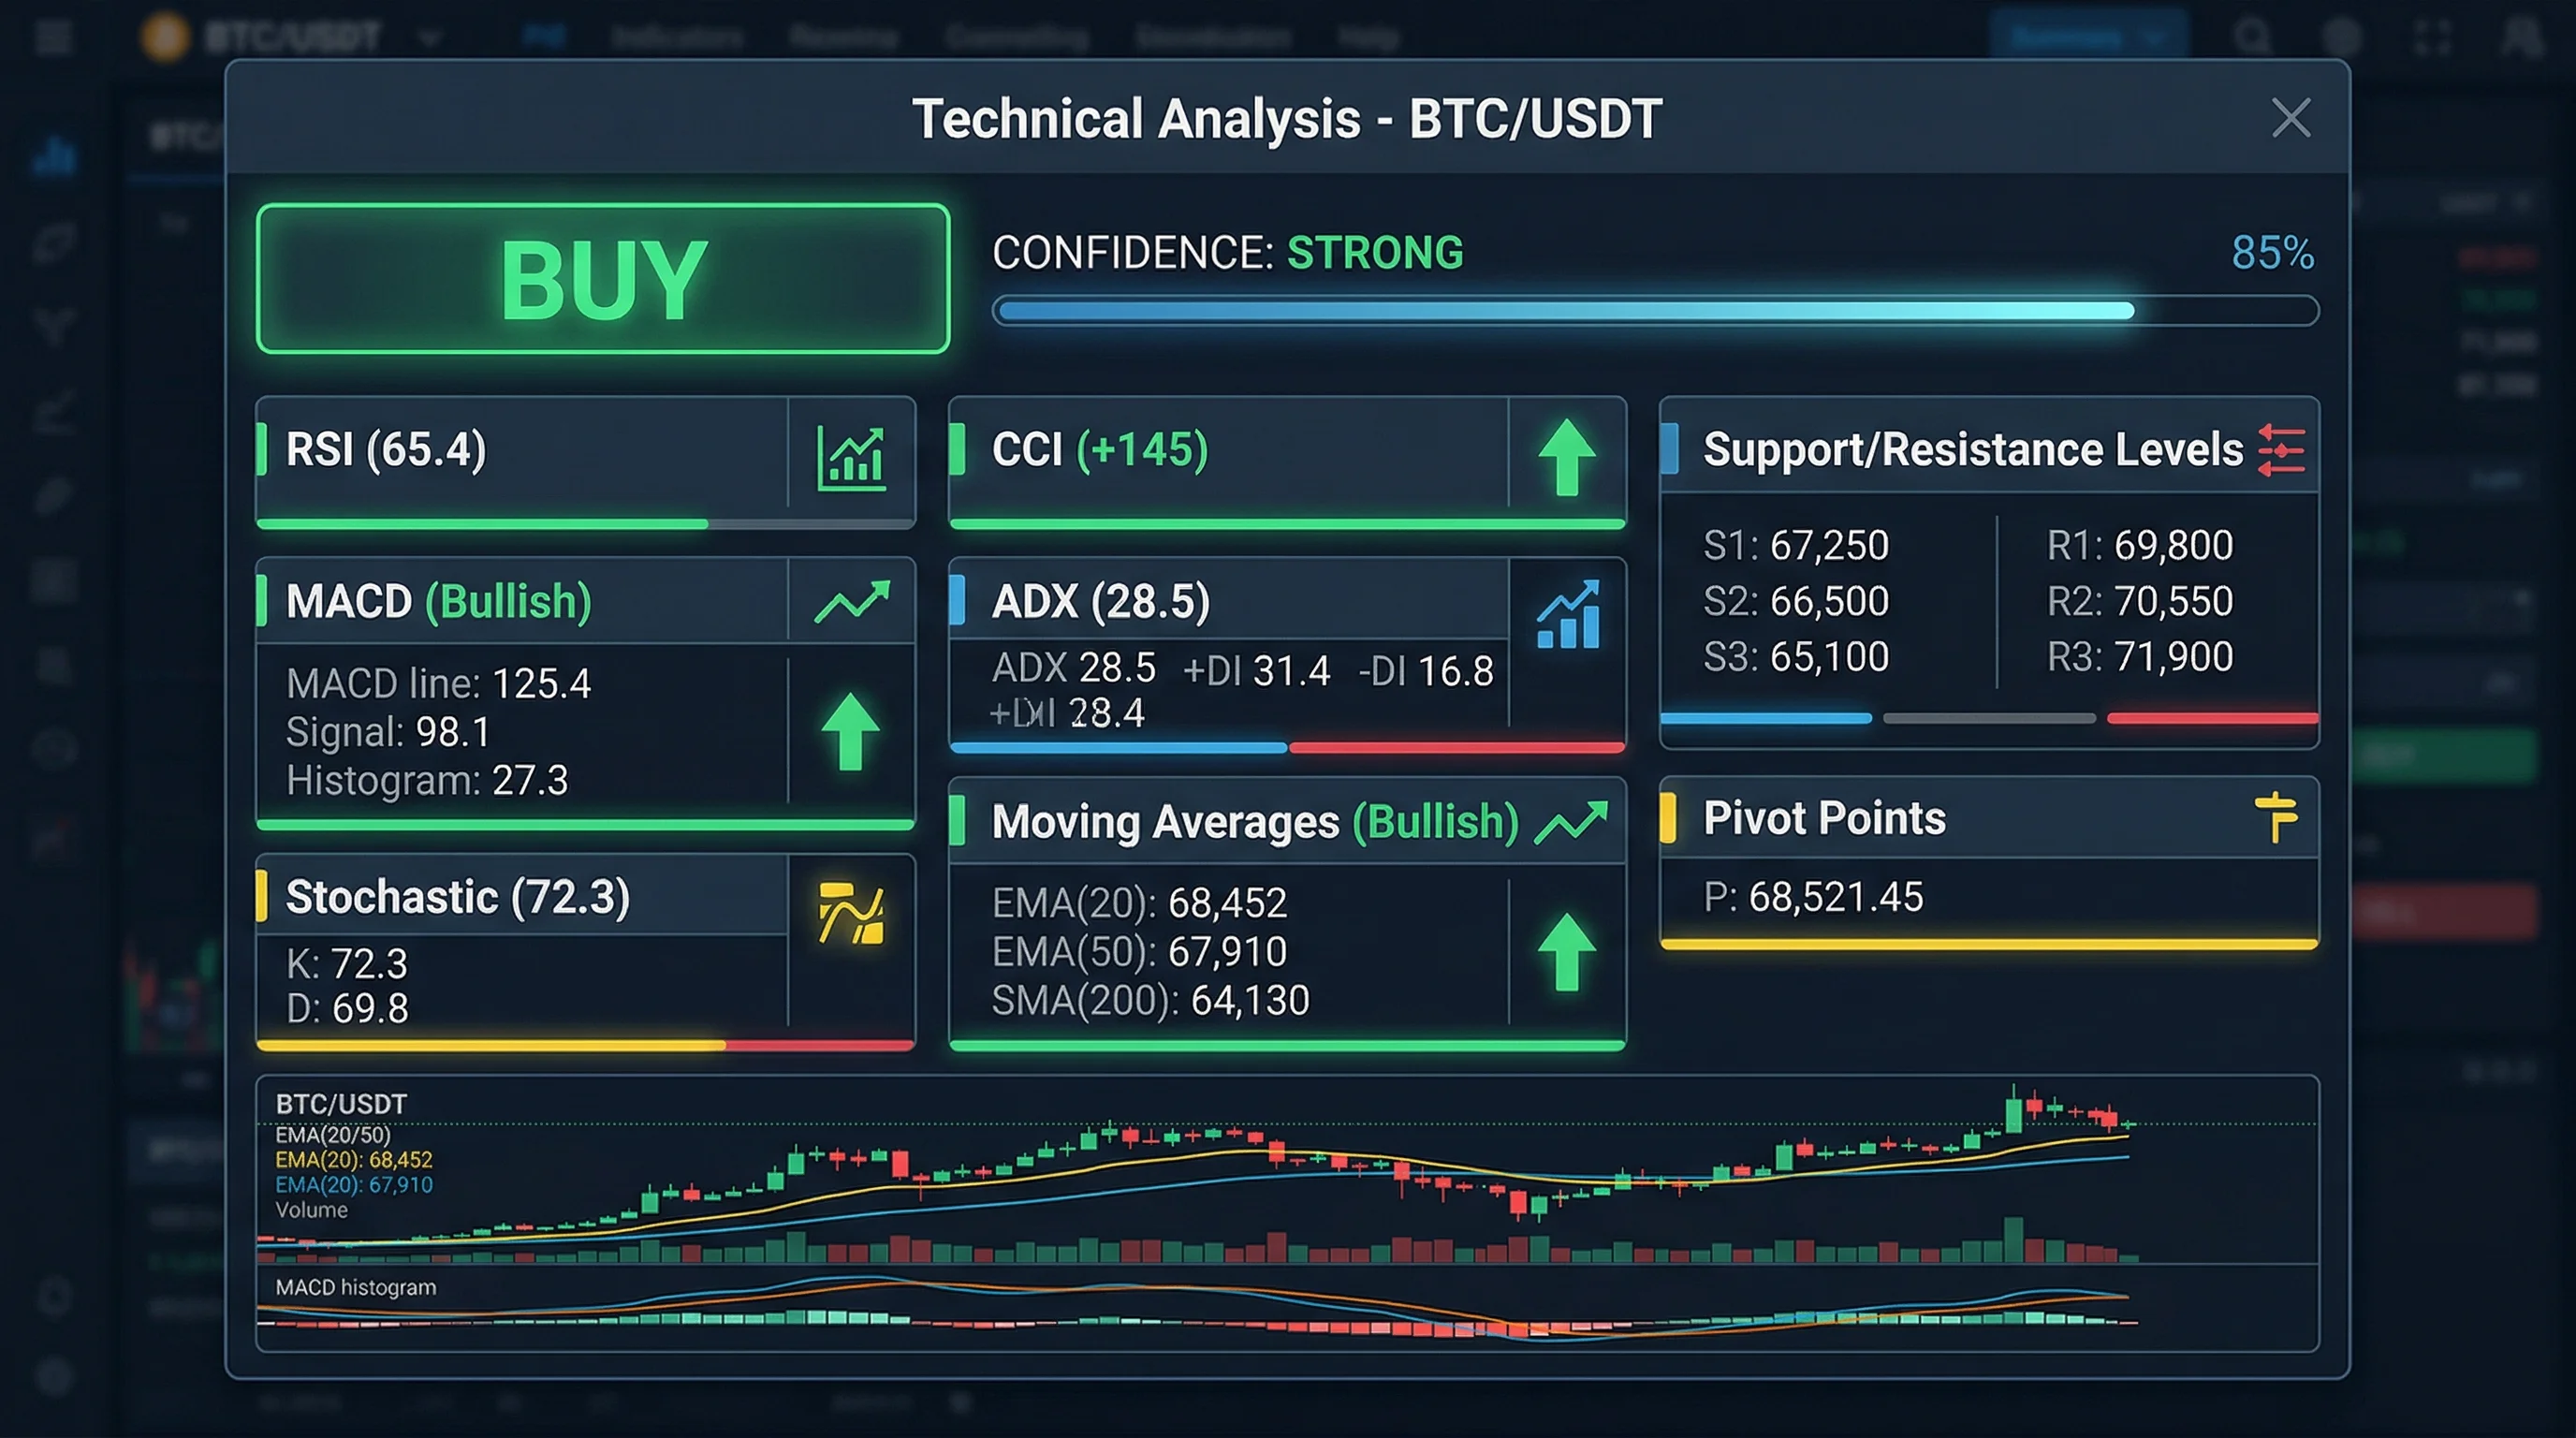 Figure: A technical analysis panel showing Buy/Sell signals, RSI, MACD, and other indicators
Charts show what happened. News helps explain why.
The API provides a general GET /api/news endpoint with optional parameters including market, lang, symbol, and market_country. For crypto dashboards, the simplest version is market=crypto with lang=en.
Crypto News Example
curl --request GET \
  --url 'https://tradingview-data1.p.rapidapi.com/api/news?market=crypto&lang=en' \
  --header 'x-rapidapi-host: tradingview-data1.p.rapidapi.com' \
  --header 'x-rapidapi-key: YOUR_API_KEY_HERE'
Use this news feed to build:
- A headline ribbon above your chart
- A right-side context panel for the active coin
- A “why is crypto moving today?” dashboard card
- Trigger labels for price alerts and volatility monitors
If you want per-asset context, the same endpoint supports optional symbol filtering. That makes it possible to create a BTC-only or ETH-only news panel from the same API family.
Step 6: Show Crypto Market Movers with the Leaderboard API
A good crypto dashboard should not only track what the user already owns. It should also surface what is moving now.
The crypto leaderboard endpoint accepts these core query parameters:
tab(required)columnset(defaultoverview)startcountlang
The API also exposes GET /api/metadata/tabs?type=crypto, which returns valid tab identifiers you can feed into the leaderboard request.
In practice, this means your dashboard can support multiple crypto discovery views instead of a single generic movers list. Common examples include:
- All coins for broad market browsing
- Gainers for momentum discovery
- Losers for reversal or volatility tracking
- DeFi coins for sector-specific monitoring
- Total value locked rank for protocol and ecosystem strength analysis
Discover Valid Crypto Tabs
curl --request GET \
  --url 'https://tradingview-data1.p.rapidapi.com/api/metadata/tabs?type=crypto' \
  --header 'x-rapidapi-host: tradingview-data1.p.rapidapi.com' \
  --header 'x-rapidapi-key: YOUR_API_KEY_HERE'
Fetch Top Crypto Gainers
curl --request GET \
  --url 'https://tradingview-data1.p.rapidapi.com/api/leaderboard/crypto?tab=gainers&columnset=overview&start=0&count=20&lang=en' \
  --header 'x-rapidapi-host: tradingview-data1.p.rapidapi.com' \
  --header 'x-rapidapi-key: YOUR_API_KEY_HERE'
This endpoint is a strong fit for:
- “Top Gainers” and “Top Losers” cards
- Heatmap sidebars
- Discovery pages for new opportunities
- Pre-market style landing pages for digital assets
A Minimal Node.js Aggregator for a Crypto Dashboard
In production, your frontend should call your own backend, and your backend should call the API. That protects your key and gives you one place to cache and normalize responses.
const API_HOST = 'tradingview-data1.p.rapidapi.com';
const API_KEY = process.env.RAPIDAPI_KEY;

async function apiGet(path, params = {}) {
  const url = new URL(`https://${API_HOST}${path}`);

  Object.entries(params).forEach(([key, value]) => {
    if (value !== undefined && value !== null) {
      url.searchParams.set(key, String(value));
    }
  });

  const response = await fetch(url, {
    headers: {
      'x-rapidapi-host': API_HOST,
      'x-rapidapi-key': API_KEY,
    },
  });

  if (!response.ok) {
    throw new Error(`API request failed: ${response.status}`);
  }

  return response.json();
}

async function getCryptoDashboard(symbol = 'BINANCE:BTCUSDT') {
  const [quote, price, ta, news, movers] = await Promise.all([
    apiGet(`/api/quote/${encodeURIComponent(symbol)}`, { session: 'regular', fields: 'all' }),
    apiGet(`/api/price/${encodeURIComponent(symbol)}`, { timeframe: '60', range: 168 }),
    apiGet(`/api/ta/${encodeURIComponent(symbol)}`),
    apiGet('/api/news', { market: 'crypto', lang: 'en' }),
    apiGet('/api/leaderboard/crypto', {
      tab: 'gainers',
      columnset: 'overview',
      start: 0,
      count: 20,
      lang: 'en',
    }),
  ]);

  return {
    symbol,
    quote,
    chart: price,
    technicalAnalysis: ta,
    headlines: news,
    topMovers: movers,
  };
}
With one aggregation function like this, your frontend can render an entire crypto dashboard from a single backend response.
Production Best Practices for Crypto API Integration
Here are the patterns that matter most once you move beyond a tutorial.
1. Keep Symbol Formatting Consistent
Always store symbols in the EXCHANGE:SYMBOL format.
Examples:
BINANCE:BTCUSDTBINANCE:ETHUSDTOKX:BTCUSDTCOINBASE:BTCUSD
This makes quote, price, TA, and chart calls predictable.
2. Cache by Data Type
Different data blocks change at different speeds.
A practical cache policy is:
- Quotes: 5 to 15 seconds
- Candles: 30 to 60 seconds for intraday views
- Technical analysis: 30 to 120 seconds
- News: 60 to 300 seconds
- Metadata: 1 to 24 hours
3. Separate Discovery from Monitoring
Use search and metadata endpoints during symbol selection. Use quote, price, and TA endpoints during ongoing monitoring. This keeps your app architecture cleaner and your refresh logic easier to reason about.
4. Design for Rate Limits Early
Even if your app starts small, build in:
- Response caching
- Request coalescing
- Batch requests where appropriate
- Retry logic for transient failures
- Graceful fallbacks for empty news or delayed indicators
5. Know When Polling Is Enough
REST polling is ideal for watchlists, research dashboards, portfolio tools, and periodic market monitoring. If your product needs much faster updates, reduce redundant polling first and move to a streaming architecture only when the user experience genuinely requires it.
For most crypto dashboard products, a strong REST architecture is enough to launch quickly. The important part is to keep symbol lookup, quotes, candles, indicators, and news logically separated so each panel refreshes at the right interval.
If you need broader API planning, the free real-time market data guide is a good companion article.
Common Crypto Dashboard Features You Can Ship Quickly
Once the core data pipeline works, you can add higher-value product features fast.
Real-Time Watchlist
Combine search, quote, and price to build a live market watchlist for Bitcoin, Ethereum, Solana, and trending altcoins.
Signal Dashboard
Use ta and ta/indicators to create a compact panel showing trend, momentum, and support/resistance context without calculating every indicator yourself.
Market Movers Board
Use metadata/tabs and leaderboard/crypto to build pages for gainers, losers, all coins, DeFi coins, or total value locked ranking views.
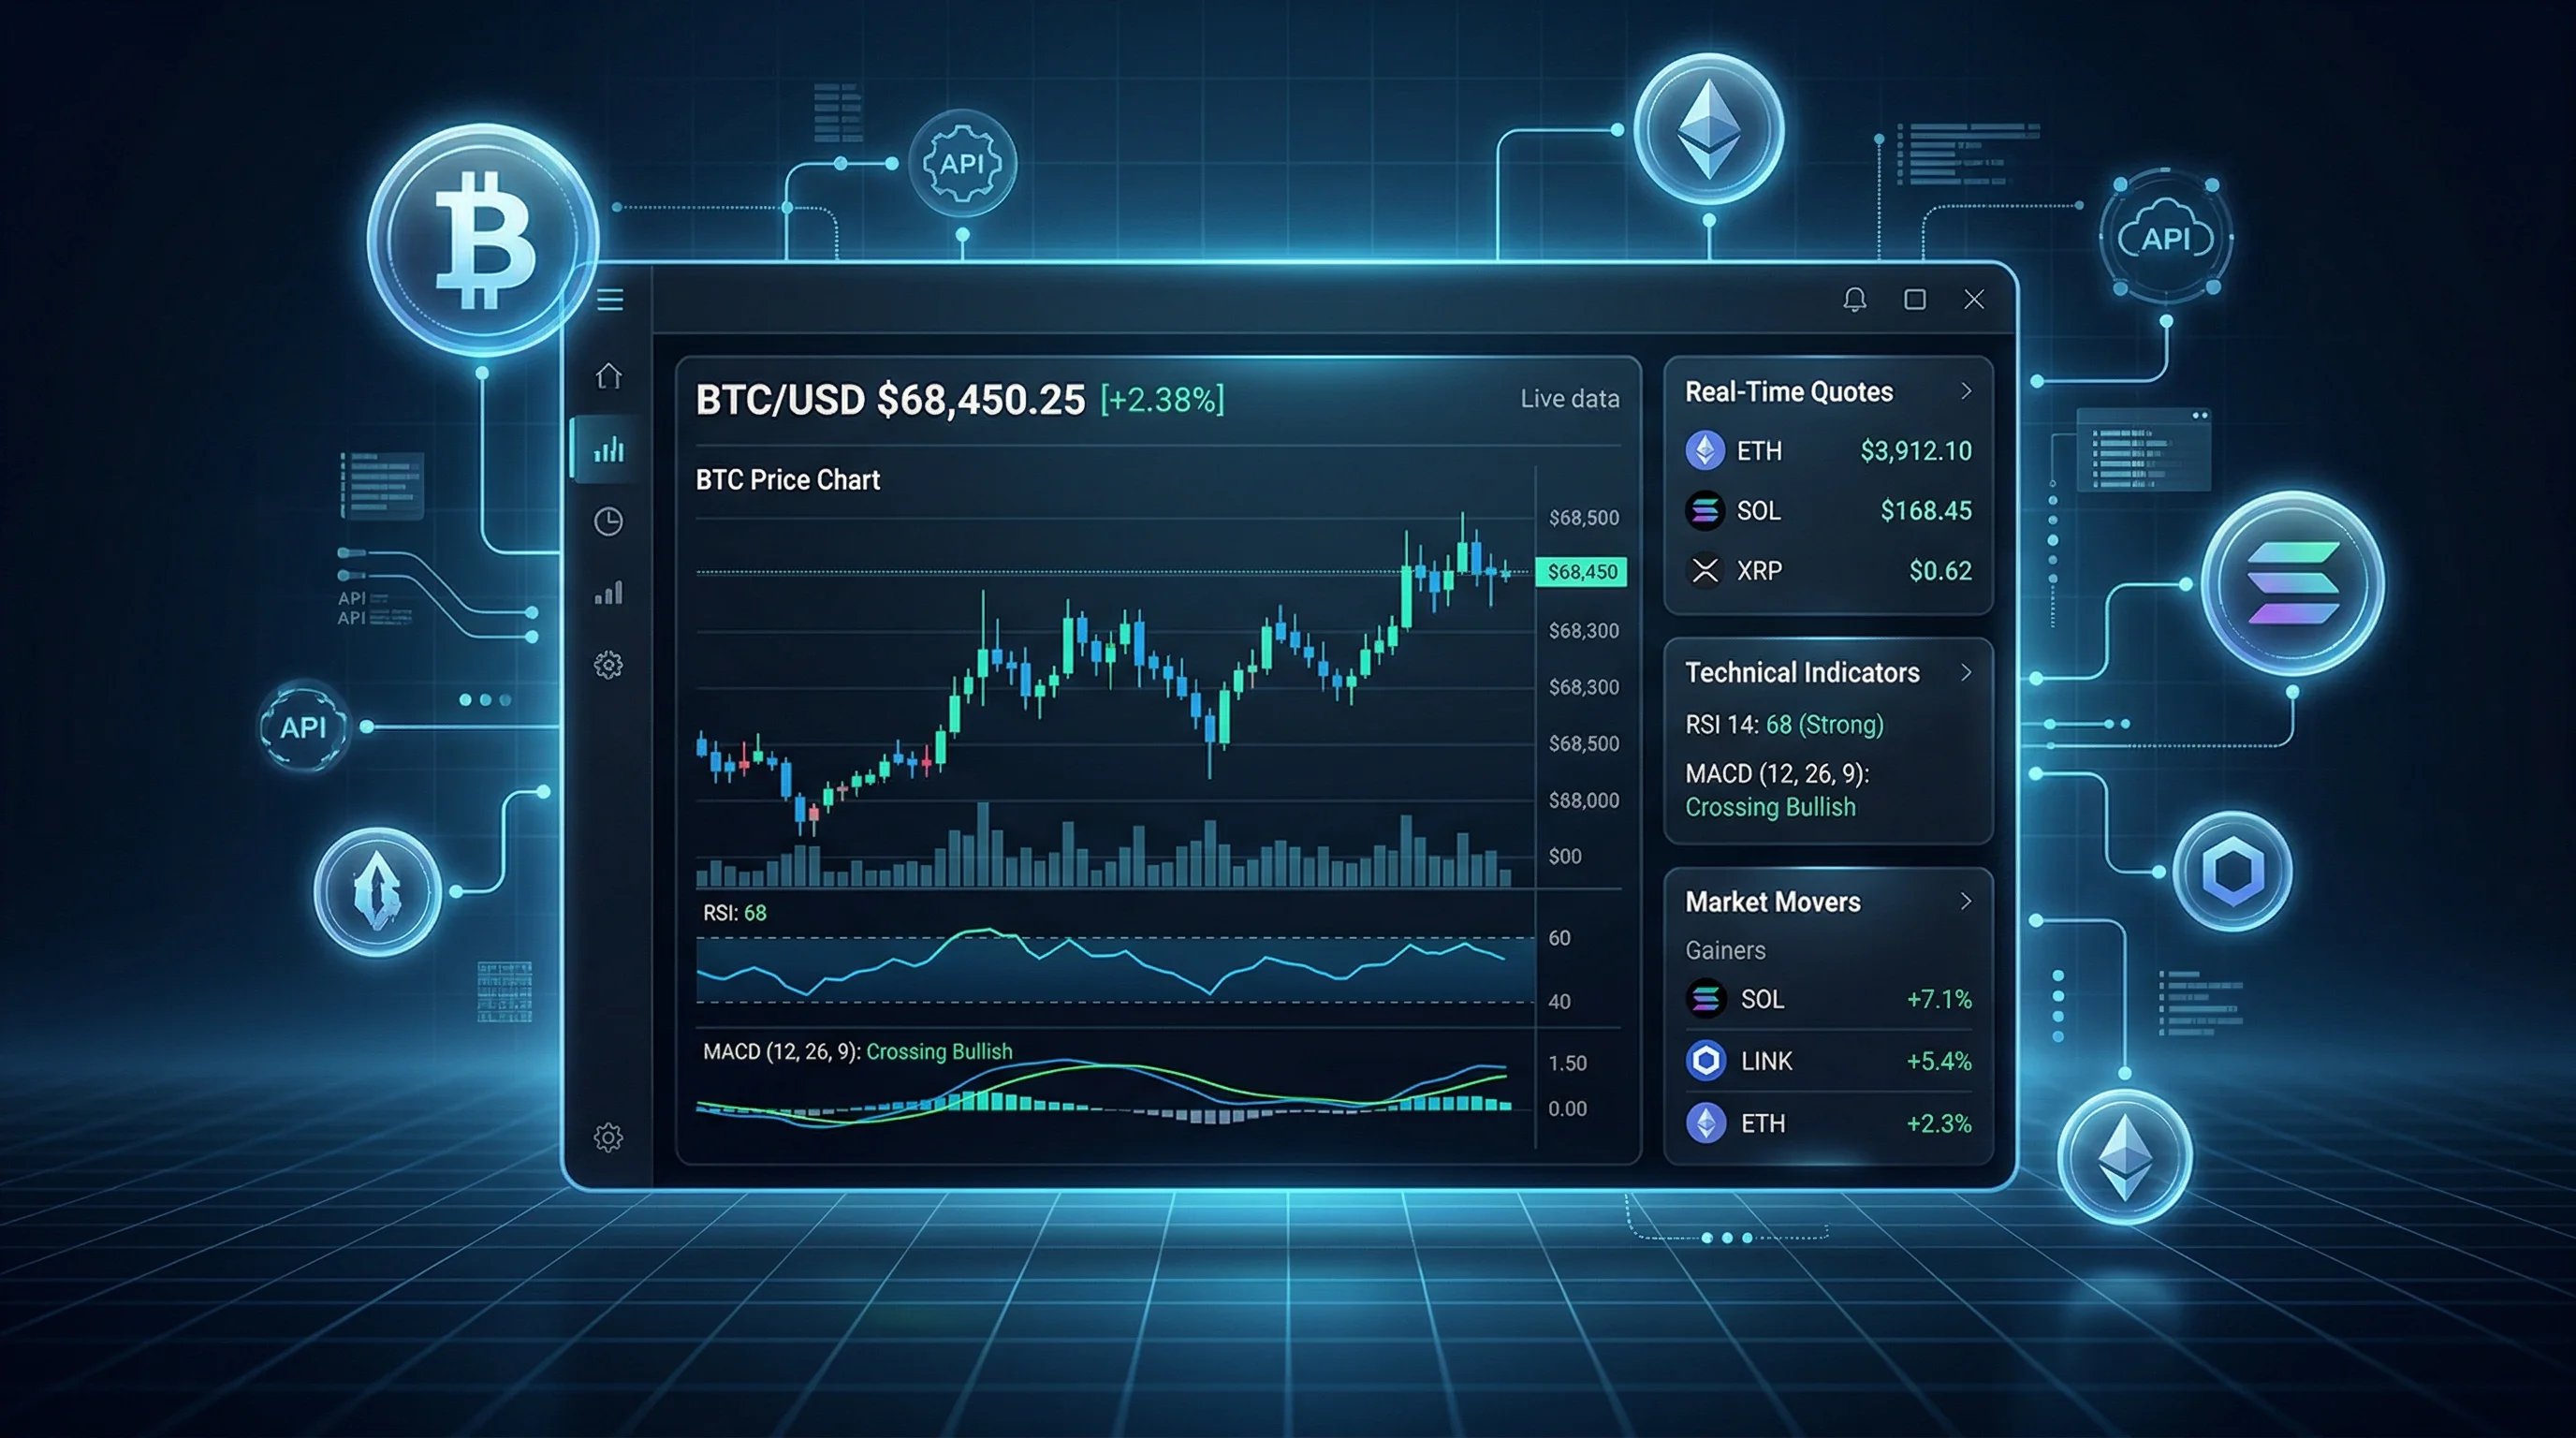
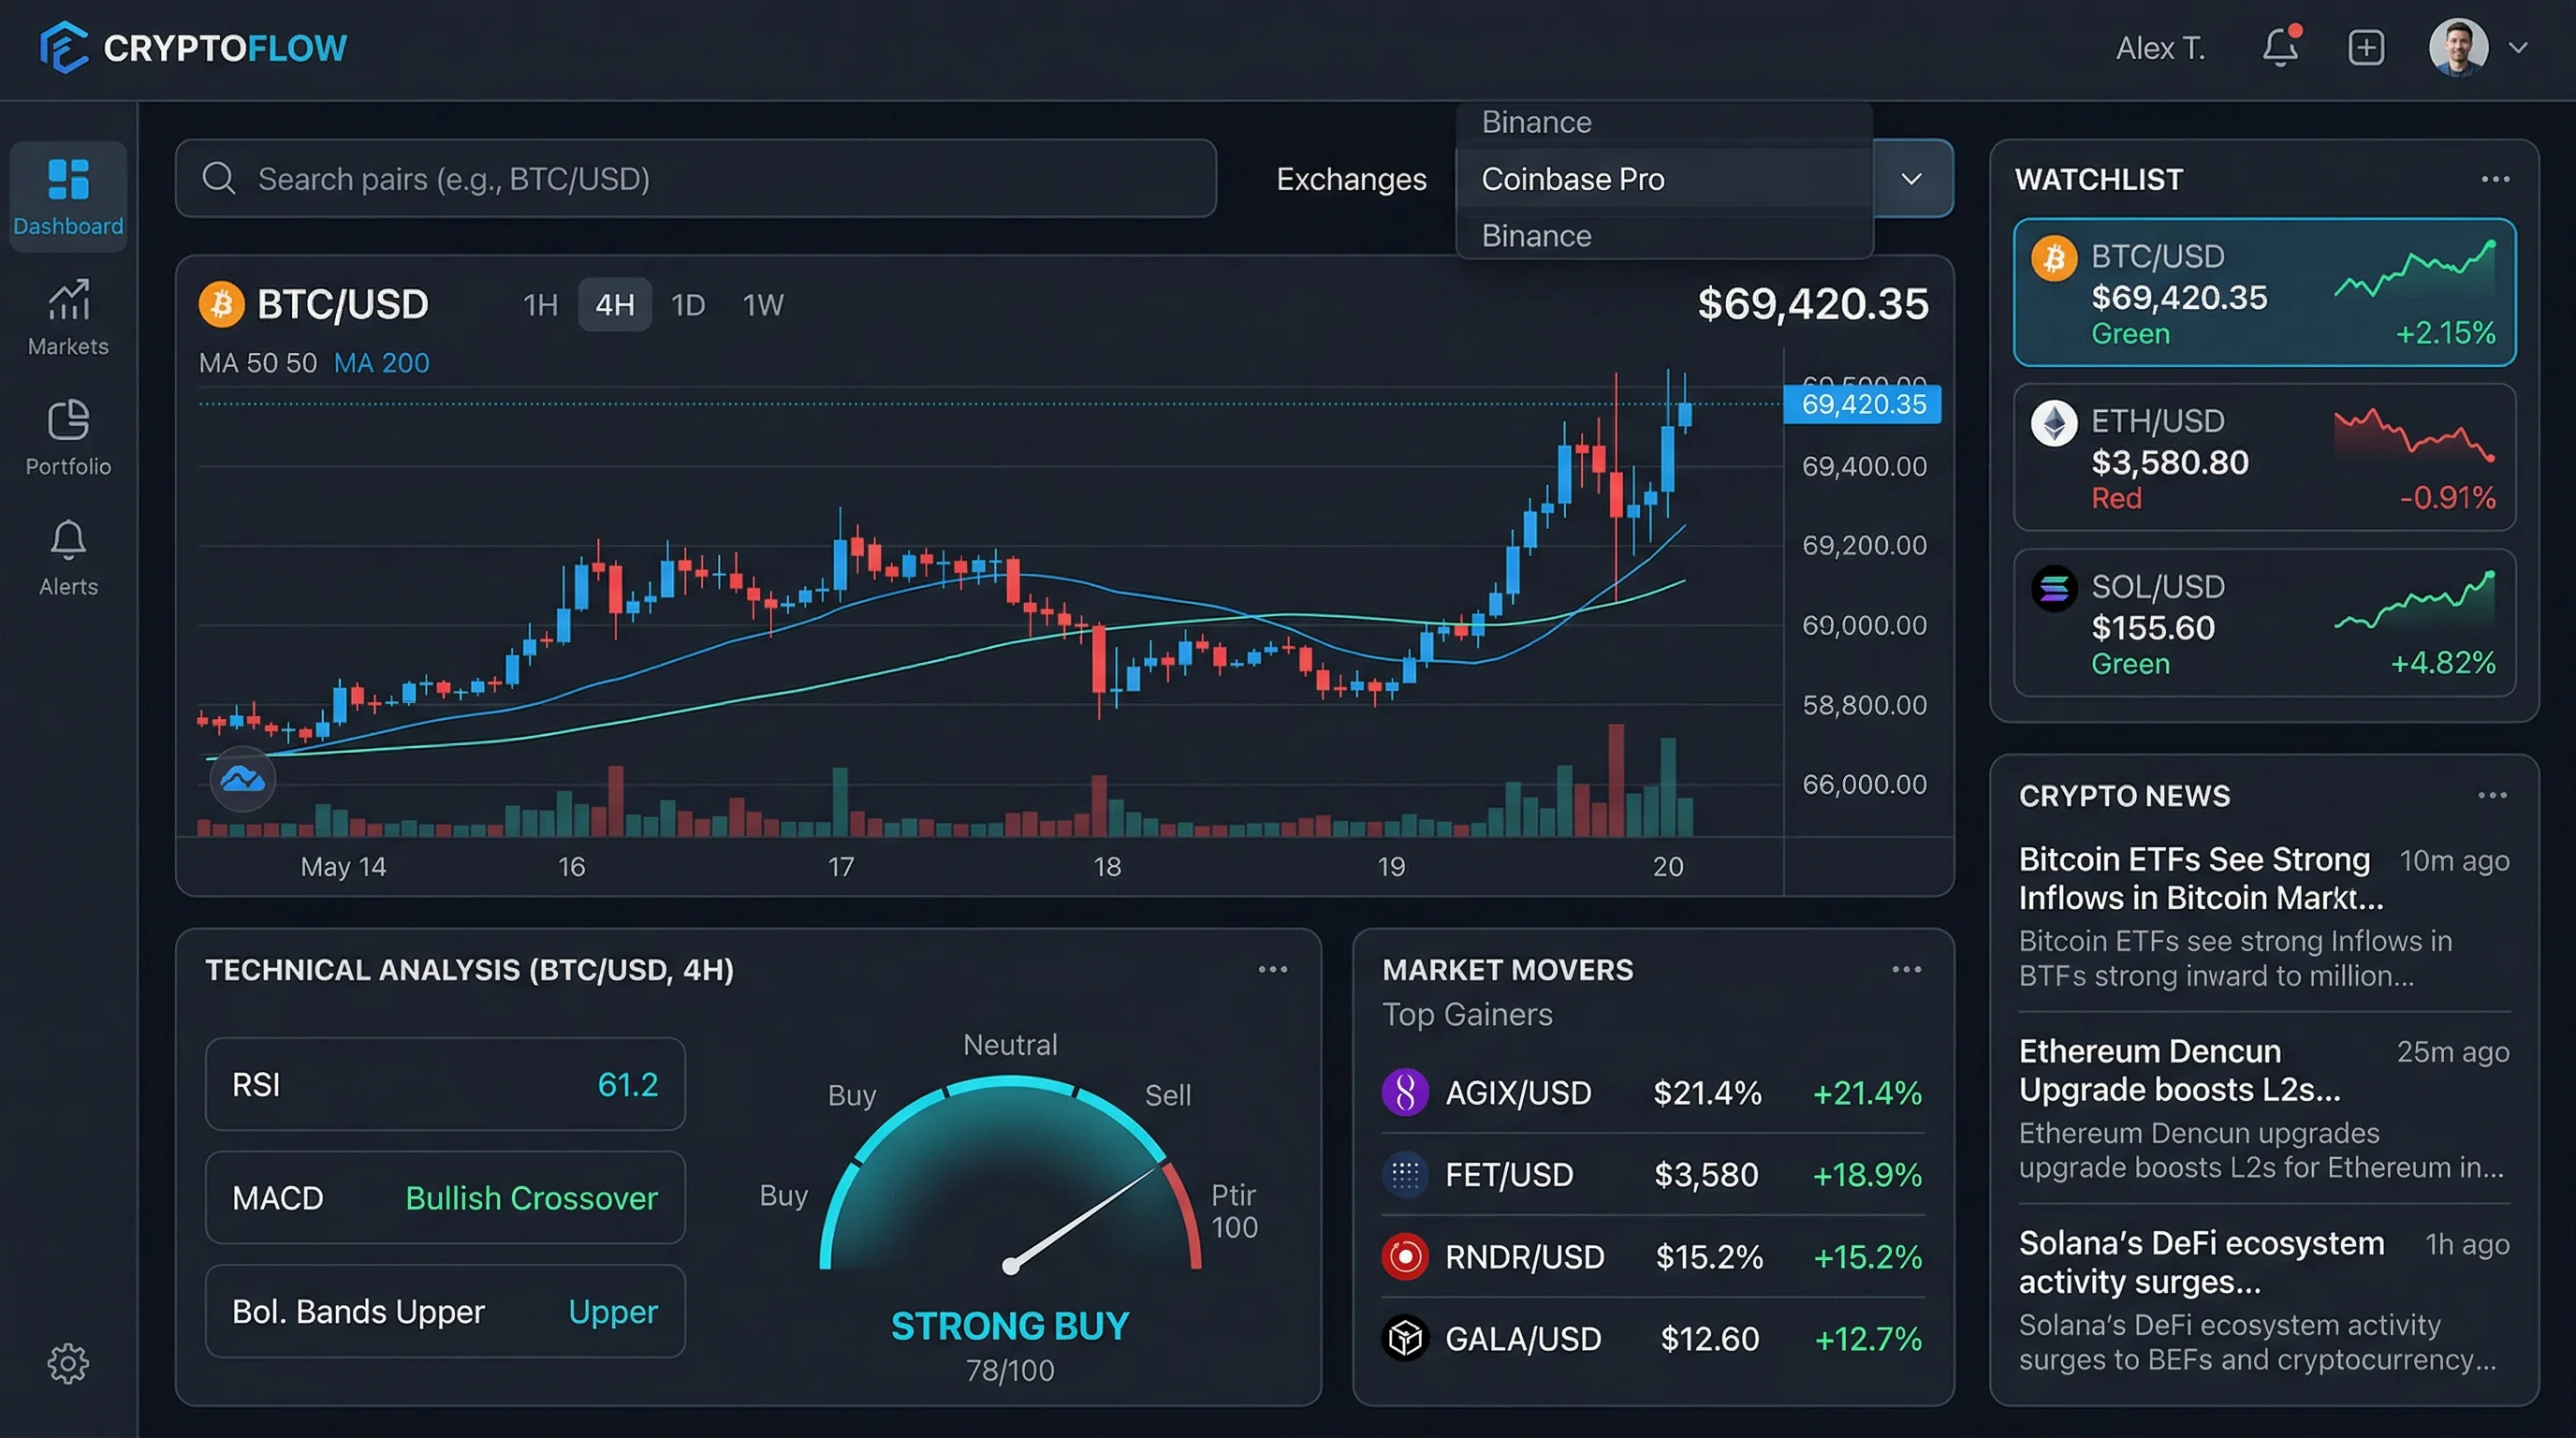 Figure: A complete crypto dashboard interface with watchlist, charts, technical analysis, and news panels
Use metadata/exchanges to let users browse pairs by exchange family.
Context-Aware Alerts
Use quote for thresholds, price for trend structure, and news for event context so alerts are smarter than a simple “price crossed X” notification.
Final Build Checklist
Before shipping your crypto dashboard, make sure you have the following pieces in place:
- A symbol search flow powered by
GET /api/search/market/{query}withfilter=crypto - A normalized symbol store using values like
BINANCE:BTCUSDT - Quote cards powered by
GET /api/quote/{symbol} - Candlestick charts powered by
GET /api/price/{symbol} - Signal panels powered by
GET /api/ta/{symbol}andGET /api/ta/{symbol}/indicators - A market context module powered by
GET /api/news?market=crypto&lang=en - A movers widget powered by
GET /api/leaderboard/crypto - Server-side key protection, caching, and graceful retry logic
Conclusion
Building a modern crypto dashboard with an API is much simpler when your provider already supports the full workflow: market discovery, quotes, chart candles, technical analysis, news, and leaderboards.
Using this endpoint set, you can build a crypto product that covers both real-time monitoring and market discovery without resorting to scraping or stitching together many unrelated services.
If you want to go further, your next steps are straightforward:
- Start with
searchandquotefor a minimal watchlist - Add
pricefor charts and historical context - Add
tafor signal overlays - Add
newsandleaderboardfor narrative and market breadth
For broader API patterns, read the TradingView API tutorial and the TradingView API vs Twelve Data API comparison.
Ready to build? Start with BINANCE:BTCUSDT, wire up the quote and price endpoints, and you can have a working crypto dashboard prototype in a single afternoon.
Frequently Asked Questions
For a practical crypto dashboard, you typically need five endpoint groups: symbol discovery, real-time quotes, OHLCV candle data, technical analysis, and news. In this guide, those map to /api/search/market/{query}, /api/quote/{symbol}, /api/price/{symbol}, /api/ta/{symbol}, and /api/news?market=crypto. Optional enhancements include /api/leaderboard/crypto for movers and /api/metadata/exchanges for exchange discovery.
Use the EXCHANGE:SYMBOL format. For example, Bitcoin on Binance is BINANCE:BTCUSDT and Ethereum on Binance is BINANCE:ETHUSDT. The exchange code can be discovered from /api/metadata/exchanges endpoint.
Yes. The same TradingView API structure works across major crypto pairs and exchanges. You can search symbols, fetch quotes, load candles, get technical analysis, read crypto news, and pull leaderboards with the same authentication and JSON workflow.
First fetch valid crypto tabs from /api/metadata/tabs?type=crypto, then call /api/leaderboard/crypto with a tab such as gainers and a columnset such as overview. This lets you build market movers widgets without scraping exchange websites.
For production applications, no. Keep your RapidAPI key on the server, proxy requests through your backend or serverless functions, and cache short-lived responses like quotes and candles to reduce rate-limit pressure.